This week for the SIA Equity Leaders Weekly, we are going to look back in at both the US Dollar/Canadian Dollar relationship and also the 30-Year Interest Rate to see if their trends have continued. Continued downward pressure on long-term interest rates has caused many long term bonds to reach new all-time highs to start off 2015.
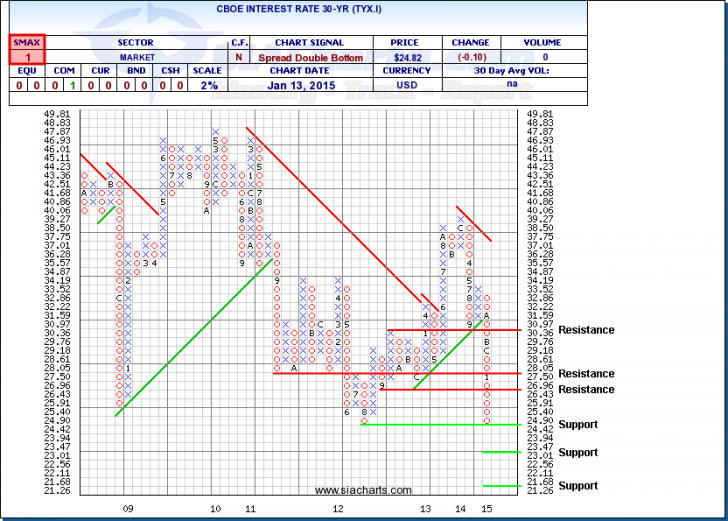
CBOE 30-Year Interest Rate (TYX.I)
Since we last looked at this chart back in December, the downward movement has continued right down to the support level at 2.442% we highlighted last time. This current drop in a column of X's has now hit ~20% which has fallen to its all-time lows from August of 2012. If it were to move past this support level, further support is found at 2.3% and at 2.126%. A reversal to the upside could see resistance levels of 2.696% and 2.805% come into play.
The SMAX score has now fallen to 1, showing short-term weakness across all asset classes. Looking at other important interest rates and yield curves, in the U.S., the yield on the 30-year Treasury bond has hit a record low and the 10-year rate fell to its lowest point since May of 2013. Using SIA's Correlation Calculator tool shows many of the long-term bonds, TLT for example, in the US are showing an inverse or negative correlation to the dropping 30-year interest rate (TYX.I). So in other words, when these long-term interest rates are dropping, it is driving bond prices up which many are reaching new all-time highs to start off 2015. This downwards pressure on long-term interest rates has helped move Bonds into the #1 in the SIA Asset Class rankings and continues to add value to advisors that understand where the strength of the bond market is coming from.
Click on Image to Enlarge
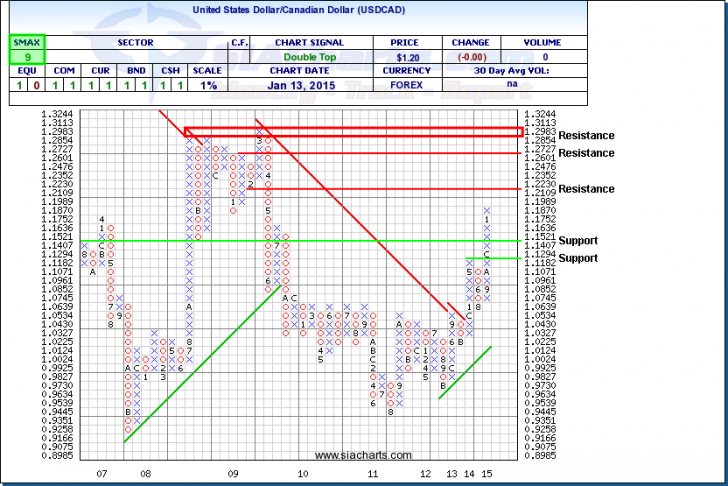
United States Dollar/Canadian Dollar (USDCAD)
Since we last looked at the USDCAD in December, the relationship has continued its strength in favor of the USD, moving up another ~2% towards $1.20 which are levels that we haven't seen with this exchange since 2009. With this continued strength, the USDCAD is now approaching the next resistance level at $1.223. Further resistance is found at $1.2727 and around $1.30, which are the highs from 2008 & 2009.
This strength has also continued to place pressure on Commodities, especially Crude Oil, and as a result on the Canadian markets as well. The Canadian dollar is down now roughly 10% from a year ago (and ~12% since the beginning of 2014) which obviously has an effect on consumer products that are tied to the U.S. as about half of all Canadian merchandise imports from the U.S. Both of these charts should continue to be closely monitored as they affect many areas of the market.
Click on Image to Enlarge
SIACharts.com specifically represents that it does not give investment advice or advocate the purchase or sale of any security or investment. None of the information contained in this website or document constitutes an offer to sell or the solicitation of an offer to buy any security or other investment or an offer to provide investment services of any kind. Neither SIACharts.com (FundCharts Inc.) nor its third party content providers shall be liable for any errors, inaccuracies or delays in content, or for any actions taken in reliance thereon.
Copyright © SIACharts.com