For this weeks SIA Equity Leaders Weekly, we are going to revisit the broad U.S. and Canadian Equity markets. We looked at both of these market indices during the last market correction on October 23rd, so feel free to pull up this past SIA Equity Leaders Weekly for reference to this commentary. The overall outlook a month ago saw U.S. Equity above Canadian Equity on a relative strength basis and continues to hold true as the S&P 500 Index moves to new all-time highs last week.
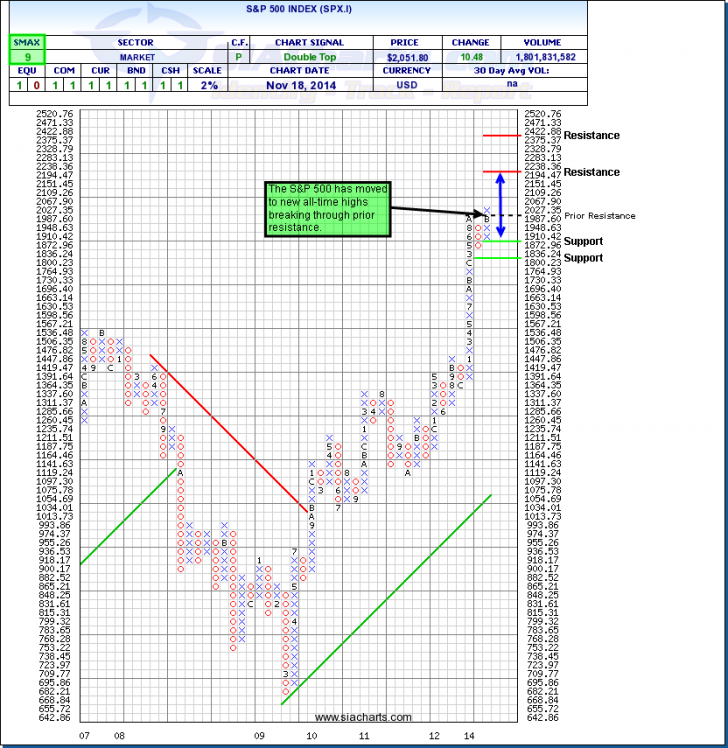
S&P 500 Index (SPX.I)
The S&P 500 (SPX.I) has moved to new all-time highs since we last looked at it a month ago where it was still in a row of O's for the first time since December of 2012. The prior resistance level at 2027.35 has now been broken and the next resistance level at 2238.36 becomes the next potential target for the U.S. index. Beyond this, further resistance could be found above at 2422. To the downside, support is now found at 1872 and at 1800.
Like in October, the S&P 500 Index is still showing a near-term strength SMAX score of 9 out of 10 and never gave a negative SMAX score during its short-term pull-back. To quote from October, "This near-term positive outlook could see the SPX.I move through to new all-time highs" and continues to show both short and long-term relative strength.
Since October 23rd when we last looked at these two indices, The SPX.I is up ~5.7% and the TSX.I is up ~3%. On the year, the SPX.I is up ~11% while the TSX.I is up ~10% in their base currency as of November 18th close. However, if we look at the SPX.I in Canadian currency, this gap becomes much larger with the SPX.I up over 18% in CAD dollars including over 10% relative outperformance over the last 3 months. This is one of the reasons we focus on the USDCAD exchange quite often in these updates because the difference between the two indices may be bigger than most advisors realize.
Click on Image to Enlarge
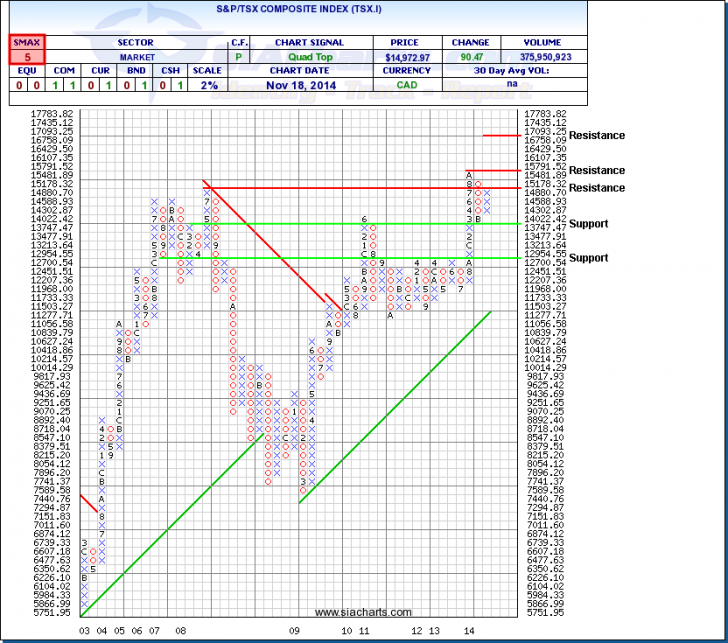
S&P/TSX Composite Index (TSX.I)
Unlike the U.S. Equity markets we just looked at, the TSX Composite Index (TSX.I) had a larger drawdown of a ~10% reversal and has not fully recovered yet to rechallenge prior highs. The TSX.I has moved up to the first resistance level at 15178, which is from the high from 2008. But the key resistance to watch for is from the prior high in 2014 at 15791.52. To the downside, support is found at 13747 and below this at 12700.
The SMAX near-term strength score is still a 5 out of 10 showing some short-term weakness against the other asset classes, especially equities. To quote from October commentary, Canadian equity "gives more red flags from a charting standpoint than the U.S. Equity pullback does" and still has some key resistance levels to move through. This outlook is confirmed when we look at the relative performance since October 23rd when we last looked at these two indices, the SPX.I is up ~5.7% and the TSX.I is up ~3%.
On the year, the SPX.I is up ~11% while the TSX.I is up ~10% in their base currency as of November 18th close. However, if we look at the SPX.I in Canadian currency, this gap becomes much larger with the SPX.I up over 18% in CAD dollars including over 10% relative outperformance over the last 3 months. This is one of the reasons we focus on the USDCAD exchange quite often in these updates because the difference between the two indices may be bigger than most advisors realize.
For more information on how to identify areas of strength and weakness in various markets or about SIA's Relative Strength methodology, please call or email us at 1-877-668-1332 or siateam@siacharts.com.
Click on Image to Enlarge
SIACharts.com specifically represents that it does not give investment advice or advocate the purchase or sale of any security or investment. None of the information contained in this website or document constitutes an offer to sell or the solicitation of an offer to buy any security or other investment or an offer to provide investment services of any kind. Neither SIACharts.com (FundCharts Inc.) nor its third party content providers shall be liable for any errors, inaccuracies or delays in content, or for any actions taken in reliance thereon.
Copyright © SIACharts.com