
For this week’s edition of the SIA Equity Leaders Weekly, we will be updating the U.S. Dollar vs. Canadian Dollar, and we will also look at Crude Oil. Both are timely topics as we are seeing continued strength in the USDCAD especially with its recent resistance level break, and then with Crude Oil moving in the opposite direction as prices continue to weaken.
United States Dollar/Canadian Dollar (USDCAD)
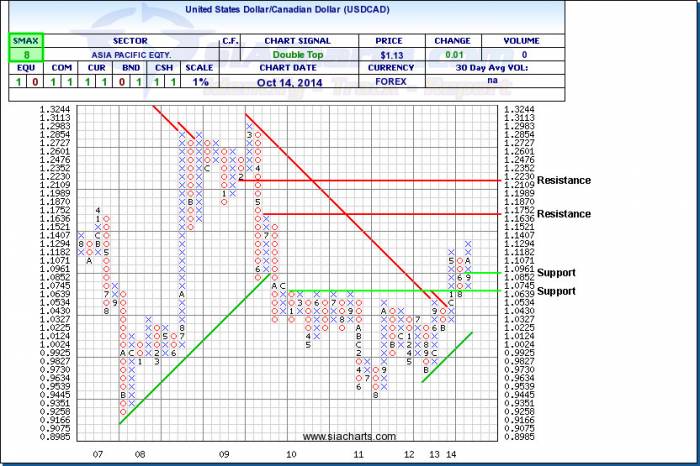
Our first chart today is the USDCAD. Since we last looked at this currency pair, it has broken key resistance at 1.1294 and is now open to test 1.1752, a level not seen since 2009. Looking to the chart today, we can see that the immediate support level is at 1.0852.
If the USD were to find itself in a strong pullback, it should reach significant downside support at 1.0639. We want to keep a close eye on this currency relationship to see if the USDCAD can stay above the recent break above 1.1294 and continue its up-trend which could skew the relationship even more against US dollar based commodities for years to come.
Click on Image to Enlarge

Crude Oil Continuous Contract (CL.F)
The Crude Oil Continuous Contract (CL.F) has continued to move down since our last month’s report. When we last examined CL.F, the SMAX was at 3 and was up against a couple of significant support levels. Since then, the commodity has pummeled through both of those support levels, first at 90.31 and then 86.80, and is now open for further weakness into the mid $70s. The next support level is found at $78.62 which is at a level not seen since 2012, and then further support not far behind at $75.56. A move through that level hasn't been witnessed since 2011 and could signal a more significant downtrend.
To the upside, resistance is found at $90.31 and then at $93.95. With the current SMAX showing a score of 0 out of 10, Crude is showing short-term weakness against all asset classes. Worth noting, as you can see from the chart, we saw a similar strong down move back in May and June of 2012 when the price miraculously rebounded back up very quickly.
Click on Image to Enlarge
SIACharts.com specifically represents that it does not give investment advice or advocate the purchase or sale of any security or investment. None of the information contained in this website or document constitutes an offer to sell or the solicitation of an offer to buy any security or other investment or an offer to provide investment services of any kind. Neither SIACharts.com (FundCharts Inc.) nor its third party content providers shall be liable for any errors, inaccuracies or delays in content, or for any actions taken in reliance thereon.
Copyright © SIACharts.com