by Adam Grimes
This is one of those technical questions that does not have a quick, simple answer. The best answer is “no, not really, and almost certainly not in the way most people think”, but there are some nuances to consider. I have done extensive quantitative work on moving averages, and the answers I have found challenge many of our ideas and many of the ways technicians use moving averages. Based on my work:
- There are no “special” moving averages. (I.e., the 200 day is not special compared to the 193, 204 or any other average.)
- Pricing crossing or touching a moving average does not have significance for future market direction.
- The slope of a moving average is not a meaningful indicator of trend.
- Crossings of moving averages are not meaningful indications of trends.
- Indicators built from moving averages are not reliable indicators of trend.
- In short, most of the things that traditional technical analysis teaches about moving averages do not stand up to quantitative scrutiny.
I can’t possibly share all of the work I have done in one blog post. I think it is bad form when someone tries to make a quantitative argument by saying “trust me”, (In fact, I just read a blog where blogger who did the same thing. He said “I’ve looked at the 200 day moving average and the market does better above it and worse below it. It works. Trust me.”), but I want to move us toward conclusions rather than getting lost in details today. We can revisit the details later, if there is interest.
The 200 day just broke. Now what?
As I write this blog, major market averages have just crossed the 200 day moving average. Everyone is talking and writing about the historical streak of closes above that average, and has been watching for the momentous first close below. Since so much attention has been focused here, it’s only reasonable to ask what happens after a major stock index crosses the 200 day moving average. The table below shows the performance of the S&P 500 cash index, qualified by the market being above or below the 200 day moving average:
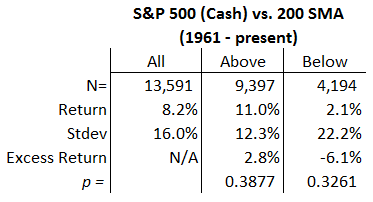
This table shows that the S&P average return has been 8.2% (annualized1). Above the 200 day, the average return annualizes to 11.0%, but when the market is below the 200 day, the return is only 2.1%. This appears to be interesting (outperformance of 2.8% above, and underperformance of -6.1% below) until we consider the degree of noise in the data.2 The problem is that the size of the “effect” is quite weak; the effect we see here is quite likely to be due to luck of the draw. You could counter that this does not matter—after all the data does show this outperformance, whether it is statistically significant or not, but if it is not statistically significant, it is probably more difficult to rely on the effect in the future. If it is not statistically significant, there’s a decent chance we’re being misled by noise.
For the record, we see similar numbers with the DJIA (4.1% above (p = 0.16) and -7.7% (p = 13) below, using data back to 1925). Whatever effect there might be appears to fade in more recent data, as the last decade shows basically no difference above and below the 200 day for both indexes. Consider, also, that we should expect to see very similar numbers since these indexes are tightly correlated.
There are also a lot of bad statistics floating around. I have seen a number of people throwing around numbers like “the S&P 500 makes 23.5% above the moving average, and -19.5% below, so crossing the moving average means the market will be weak.” Can you guess where numbers like that come from? You got it, this error, counting the crossing day (which will nearly always be up for above and down for below) in the wrong category is enough to massively skew the stats. Be careful.
Unfortunately, this is not a crystal clear statistical answer; to really understand it we have to be able to think about significance, stationarity, and a few other concepts. Someone determined to believe in the 200 day could look at the results in the table above, ignore the significance tests, and say that there is an effect, even if it’s a small one. At the very least, we need to acknowledge that there is pretty much no effect for the last two decades, so maybe something changed between World War I and today, but, it’s difficult to justify the attention put on the 200 day moving average when we have much better tools that work much better.
Fading effect over time?
Here’s another illustration that shows the fading of the effect in recent decades. (This is drawn from the unpublished part of my book which had about 30 pages on moving averages with over 25 tables and figures.) I replicated one of the tests in the Brock, Lakonishok, and LeBaron’s landmark paper on technical trading signals((http://www.jstor.org/stable/2328994)). which was basically price crossing a 50 period SMA, and here are the results that correspond, roughly, to the time period they examined in their paper:
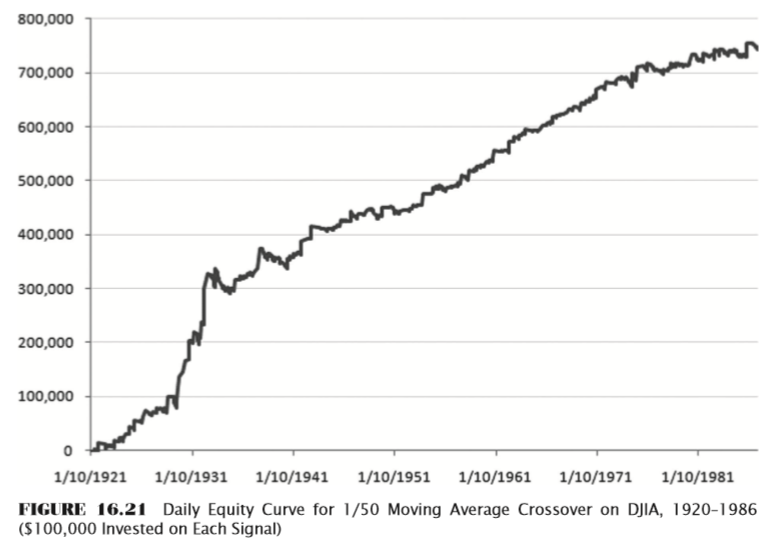
Pretty nice system, based on that equity curve. Also, think about the historical periods covered there: This system worked through the Great Depression, World War II, several recessions, shifting macro influences–and the equity curve just kept climbing. However, look at what happened if you’d traded the same system from then on:
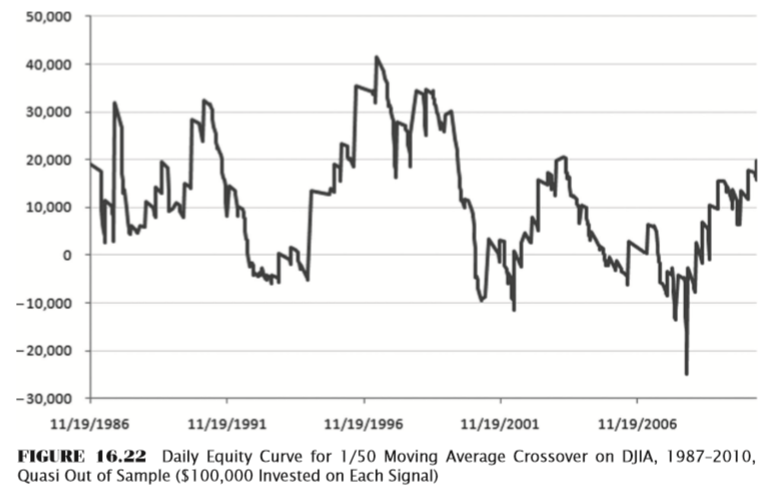 Not really what we’re looking for. There could be any number of explanations for this stark difference, but it warns us not to put too much attention (if any) on moving average crosses.
Some final thoughts
This post has only examined two moving averages on two stock indexes. Though the results are not crystal clear, it is at least obvious that there is no strong effect from price crossing the 200 day moving average. (I’ll follow up soon with a post that looks at other assets and other averages.) There really appears to be no effect at all, and I think there is a dissonance here that demands resolution: how can a trader be aware of the quantitative tendencies, understand the statistics, and still pay attention to price crossing a moving average?
I can tell you my personal solution, but you will have to find your own: I never look at or pay any attention to the 50, 100, or 200 period moving averages, and I pretty much stop reading anything as soon as I see someone discussing a touch, crossing, or slope of one of those averages–my statistical work has strongly suggested that these tools have no power, and we have better tools. Just because you hear everyone talking about something, that does not mean it is useful, and it does not mean it works. Make your own choices, but make them with an awareness of the statistical tendencies at work in the market.
- meaning that the daily return would compound to this number if annualized. It is a little bit easier to understand these numbers intuitive than to look at something like 30 bps ↩
- I really need to write a post on significance testing. Please excuse my generalizations until I do so. ↩
Copyright © Adam Grimes