
For this week's SIA Equity Leaders Weekly, we are going to revisit a theme we have spoken about often ... subjective analysis vs objective supply & demand. To do so, we will examine the charts of Apple and Blackberry as these are two holdings most investors are familiar with and have most likely held in their portfolios in the past.
Apple Inc. (AAPL)
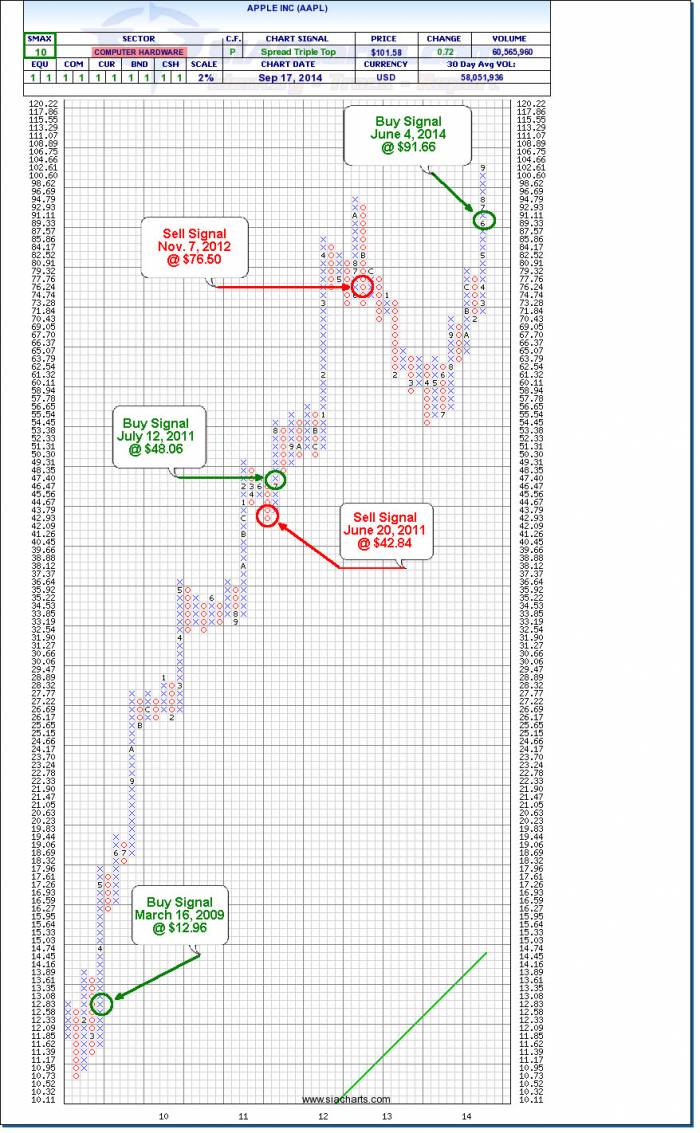
The PnF Chart of Apple shows our Buy and Sell Signals going back to mid-2009. Before this, we recommended to be completely out of the markets and in Cash based on the fact that our Equity Action Call was in the Unfavoured Zone. AAPL hit our Buy signals on March 16, 2009 @$12.96 (chart has been adjusted for 7 to 1 stock split in June 2014). AAPL experienced a short whipsaw (sell & buy signal in close proximity) in mid-2011 but entered back into this trade at $48.06. Our last Sell Signal was hit on Nov.7, 2012 @$76.50 after which it experienced a ~30% correction. It has recently hit our Buy Signal again on June 4, 2014 @$91.66.
PnF Charts provide us with an uncontaminated perspective of the supply & demand characteristics of Apple during this timeframe. We use PnF Charts as the foundation of our Relative Strength calculations. During this time, there were numerous "opinions" on Apple and whether or not the parabolic rise was warranted. Opinions count for nothing in investing! The only participant who is right 100% of the time is the "market" itself! Aligning yourself with the market rather than focusing on the "opinions" of others, increases the probability in your favour. It doesn't guarantee that every trade will work out, there is no such thing in investing! However, we believe an investment process built upon supply & demand is a more solid foundation than one built upon the opinions of others!
Click on Image to Enlarge
Blackberry Ltd. (BB.TO)
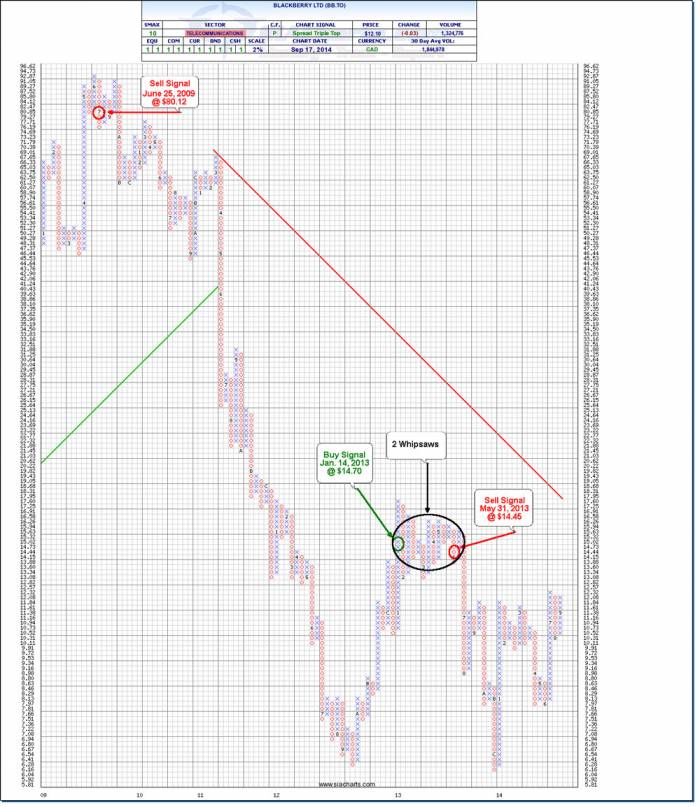
Blackberry experienced very different price action over the past 6 years than Apple. This was also a classic example of many professionals being caught in the "value trap" as the price plummeted over 90% during this time period. Many professionals mistakenly believed that a lower price meant less risk, however in our view a declining price meant supply was overtaking demand and to try and "guess" at the bottom was a much more risky proposition. BB.TO hit our Sell Signal on June 25, 2009 @$80.12. Over the next 3 years BB.TO fell off a cliff and declined over 90%. On Jan.14, 2013 BB.TO hit our Buy Signal @$14.70. It experienced 2 whipsaws during this volatile period as the price fluctuated between $13 and $16 before resuming its Relative Weakness and again hit our Sell Signal on May 31, 2013 @$14.45, after which it proceeded to drop approx 50% over the next 6 months.
Many advisors have asked why BB.TO has not hit our Buy Signals again within the S&P/TSX60 Report since it is up over 50% YTD 2014? The reason is that we are looking at the longer term Relative Strength trend in BB.TO vs its peer group, many of whom have also had very strong numbers this year. BB.TO has experienced huge volatility in both directions over the past year and while it didn't capture the 50% uptrend this year, it did help investors to avoid the 50% downtrend prior to this move. Should BB.TO demonstrate consistent "strength" vs its peer group in the future, we can expect it to move higher up the report. In the meantime, we will leave the subjective analysis to others and focus our attention on objective supply & demand, making sure to align ourselves with the market thereby also reducing our risk!
Click on Image to Enlarge
SIACharts.com specifically represents that it does not give investment advice or advocate the purchase or sale of any security or investment. None of the information contained in this website or document constitutes an offer to sell or the solicitation of an offer to buy any security or other investment or an offer to provide investment services of any kind. Neither SIACharts.com (FundCharts Inc.) nor its third party content providers shall be liable for any errors, inaccuracies or delays in content, or for any actions taken in reliance thereon.
Copyright © SIACharts.com