Homesick
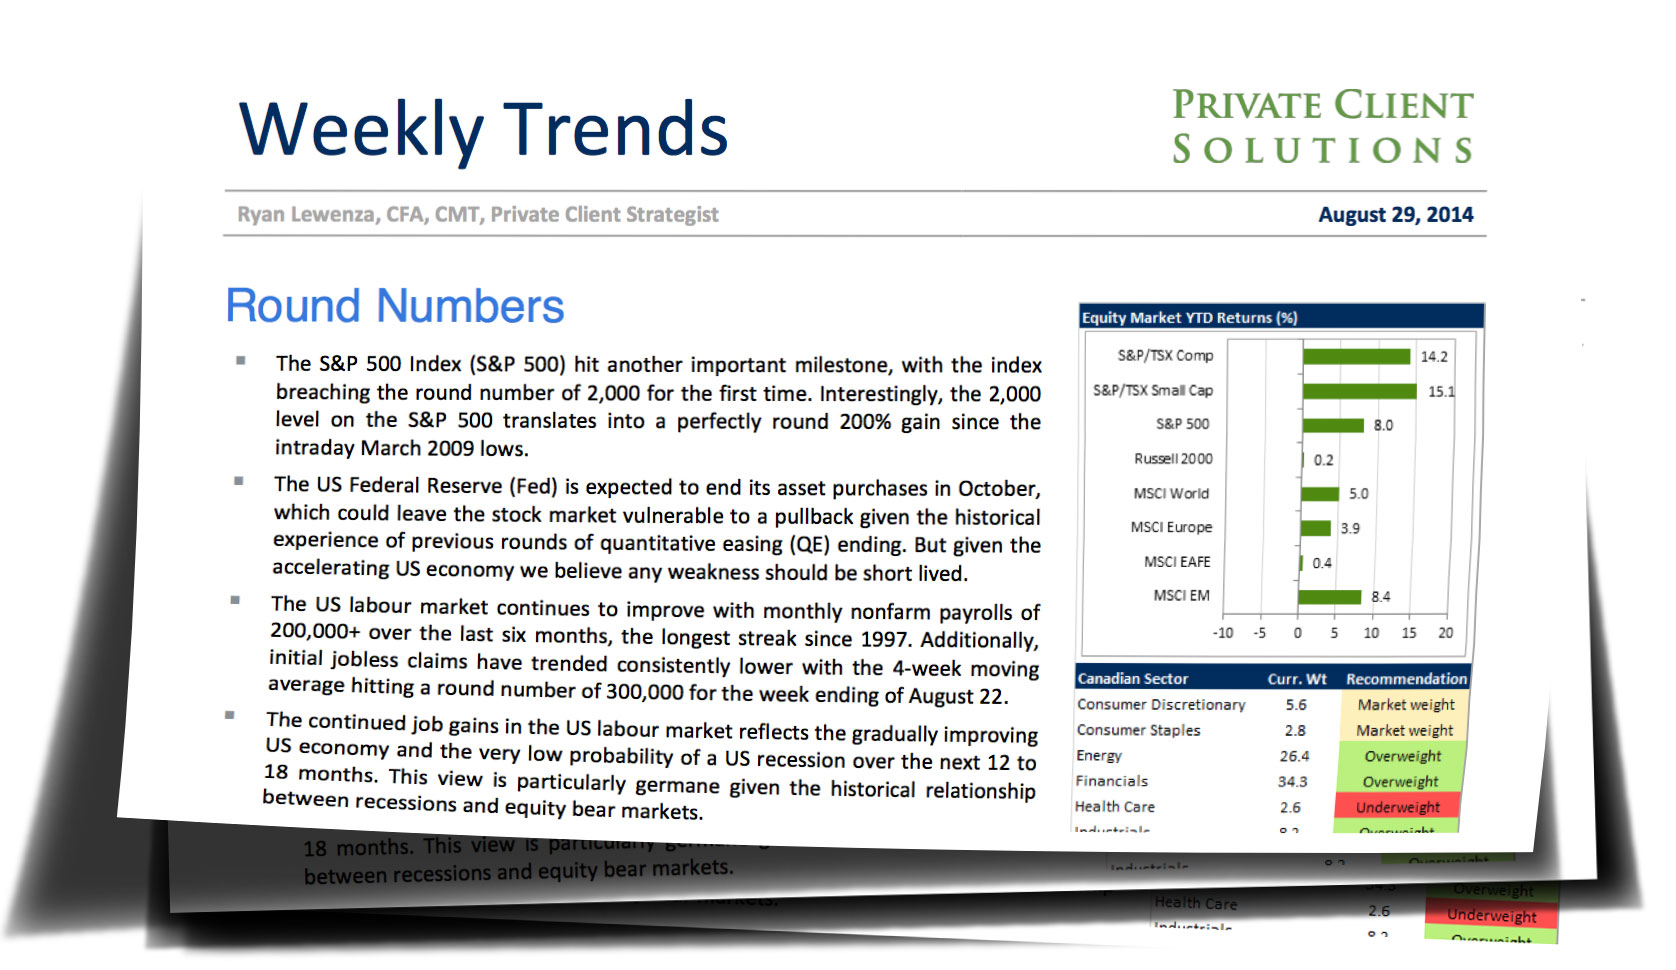
by Jeffrey Saut, Chief Investment Strategist, Raymond James
September 2, 2014
Because interest rates, credit growth and prices are mutually interdependent, the problem of analyzing their trends can be approached from a variety of starting points. In past reports we have looked at the level of rates as a measure of affordability of credit usage from a borrower’s perspective and have come to the conclusion that money was too costly in relation to growth rates of incomes, profits or collateral values for much more credit growth to be sustained without producing a parallel growth of defaults, failures and forced liquidations. The general effect of this process is to slow the growth of total credit by undermining its quality and longevity. . . . Another perspective from which we have examined the problem is that of asset prices and their role in changing the supply/demand balance and thereby influencing the demand for credit as a means of acquiring assets. We have examined the way in which asset prices in and of themselves can reach levels at which excesses and deficiencies in supply and demand can change the basic price trend of any given asset category. ... The present situation in real estate bears some striking similarities to the heyday of the railroads. The initial boom period of the 1970s was sparked by a combination of high inflation, low real interest rates and a migration of population to the then prosperous commodity producing regions. As the continuing inflation made leveraged real assets financed at fixed rates more and more attractive, nearly limitless pools of capital were made available for construction, regardless of the initial economics of the project.
... Comstock Partners, “Homesick” (7/29/88)
In 1986 Stan Salvigsen, Michael Aronstein, and Charles Minter left Merrill Lynch to form the money management firm Comstock Partners. Thus began some of the best, and most colorful, economic/equity research Wall Street has known. I still vividly remember one of their initial reports, “That Ain’t Mud on Your Boots, Partner.” The trifecta were one of the first to predict the massive decline in interest rates, but unfortunately Stan passed away at 53 and was unable to realize how terrific that “call” would prove to be. I was reminded of Comstock’s report titled “Homesick” by recent cries from select pundits that the real estate/housing recovery is over. Those cries have echoed down the canyons of Wall Street for weeks, but seemed to hit their zenith when last Monday’s new home sales were much weaker than expected. Indeed, the median forecast was for sales of 430,000 homes on a seasonally adjusted annualized rate, yet the actual number was 412,000. Remember, however, there is a large level of uncertainty in the monthly figures. July sales were reported as -2.4% +/- 11.9% – meaning that we can be 90% certain the true monthly change was between -14.3% and +9.5%. As our economist, Scott Brown Ph.D. writes, “That is, the reported decrease in July is not statistically different from 0%. Also, note that the median sales price is dependent on the mix of homes sold (regional strength, high-end vs. low-end, etc.) and is not a good measure of home prices in general. Despite said uncertainty, the spin masters trumpeted those numbers prove the Housing Hurray is over.
Their “proof” is allegedly reflected by the fact that “all cash” home sales have fallen to ~38% in the recent quarter from the previous quarter’s 42% level. While that may sound like a worrisome trend, common sense suggests private equity firms like Blackstone, who here in the Tampa area bought roughly $1 billion worth of “short sale” homes, have sucked-up the available supply. To wit, the inventory of vacant homes for rent/sale has declined from 6.6 million units in 2009 to ~5 million currently. The Blackstones of the world also are now competing with individuals that need to buy a house as household formations finally begin to increase. But there are more reasons the housing recovery is still in place. As my friends at the GaveKal organization write:
US households are no longer overleveraged. The household leverage ratio, measured by household debt to asset ratio, has declined back to 1990s level and household debt has begun to show some slight uptick. Given the (diminished) structural growth outlook for the US economy such reduced levels of average indebtedness look appropriate, certainly based on historical norms (see charts 1 and 2). [Further], Banks have started to loosen credit standards for prime mortgages, while standards for subprime lending, which tightened after the bust, look to be on the point of relaxation. Easier finance is a vital ingredient needed to draw back into the market homebuyers that have been squeezed out by effective financial exclusion (chart 3). [Finally], more expensive rental housing is pushing people to buy rather than rent. Home ownership affordability is near its average of the last 20 years. By contrast, the migration into rental housing caused by the 2007-11 bust has made renting very expensive. Households face the choice of enduring higher rents or getting back on the housing ladder, even if they missed the easy price gains of the last three years (chart 4).
I was just with some of the folks from GaveKal and was fortunate enough to discuss various strategies that have allowed their mutual funds to outperform respective benchmarks. I also opined that given their views on an improving real estate market (I agree), and my views on a healthy automobile market, it seems remote that the U.S. economy will slide back into a soft economic spot. Plainly, that’s what the equity markets are sensing as they continue to ignore the obviously worsening geopolitical environment. Combine that backdrop with the 11.7% 2Q14 earnings growth, and the 6% revenue-per-share gains, and is it any wonder the equity markets remain perky. Does that mean we won’t get a 10% - 12% pullback? Of course it doesn’t! Everyone knows it is coming, they just don’t know when. As stated, I thought there was a high degree of probability such a decline had begun in July, but after falling through its first support zone (1940 – 1950) the S&P 500 (SPX/2003.37) stayed above its secondary support zone of 1890 – 1900 and re-rallied to a new all-time high. Too bad the same cannot be said for the D-J industrials (INDU/17098.45), or the D-J Transports (TRAN/8408.02), causing one Wall Street wag to exclaim, “Can you spell non-confirmation?!”
Speaking to the report (internal use only) that Andrew Adams “inked” about various investment ideas from our recent meetings with portfolio managers (PMs), and that are followed by Raymond James’ fundamental analysts with favorable ratings titled “Invest With The Best,” I have received numerous requests for those names and the stories accompanying them. This morning I will share two. The first is Starwood Hotels & Resorts Worldwide (HOT/$84.54/Outperform) and according to the PM I met with Starwood has announced plans to and is repurchasing 10% of its outstanding stock and moving toward an “asset light” business model. That means the company will be selling some $2 billion (or more) worth of hotel properties in lieu of managing them rather than owning them. The PM’s opinion is Starwood will be distributing some of the cash raised in the form of dividends. The second idea garnered from our recent meetings with PMs is Mohawk Industries (MHK/$146.02/ Outperform). In this case the PM thinks 80% of revenues come from the “new” and “remodel” businesses. Moreover, Mohawk is first, or second, in each of its business segments. According to this PM, the company has $10+ per share in earnings power, yet is trading at 13x depressed forward earnings. For more information, please see our fundamental analysts’ recent reports.
The call for this week: Mark Twain once said, “OCTOBER: This is one of the peculiarly dangerous months to speculate in stocks. The others are July, January, September, April, November, May, March, June, December, August, and February.” But the truth is the month of September has the worst track record. So we enter the month of September, which since 1928 has experienced an average decline of 1.07% and has seen gains a mere 45.3% of the time. That said, the August 11, 2014 traders’ “buy signal” we identified was reinforced when the SPX broke out above its previous support zone, which then became the overhead resistance zone of 1940-1950, and traded to a new reaction high. This morning, the SPX preopening futures are higher by 4 points despite Putin’s Prose about being able to take Kiev in a fortnight and his reminder that Russia is a major nuclear power. To me, it is pretty eerie our markets can ignore such rants.