

by Adam Butler, http://gestaltu.com
Systematic researchers overwhelmingly use monthly holding periods to test strategies. This is probably driven by the availability of long-term monthly total return data for a wide variety of indexes, where daily data is more scarce. This is fine to a point, but investors may not be aware of just how sensitive results might be to day-of-the-month effects which may not persist out of sample.
I admit that until a couple of years ago we failed to account for these effects as well. While we use daily data for testing, we embraced the monthly rebalancing convention for easy comparisons against other published strategies, and for parsimonious prototyping. Only after we validated a method using monthly rebalancing did we take the more time consuming step of exploring it at a daily frequency.
However we discovered that results at monthly trade frequencies are often misleading. Moreover, this effect appears to be especially problematic for momentum based systems, with slightly less troubling results for moving average approaches (see here). Results observed when trades were executed on the first day of the month based on signals generated from closing prices on the last day of the month were often higher than those observed when signals and trades were generated on other days in the month. This is alarming because return and volatility assumptions for a system might be substantially over- or understated based on lucky or unlucky trade dates in historical testing.
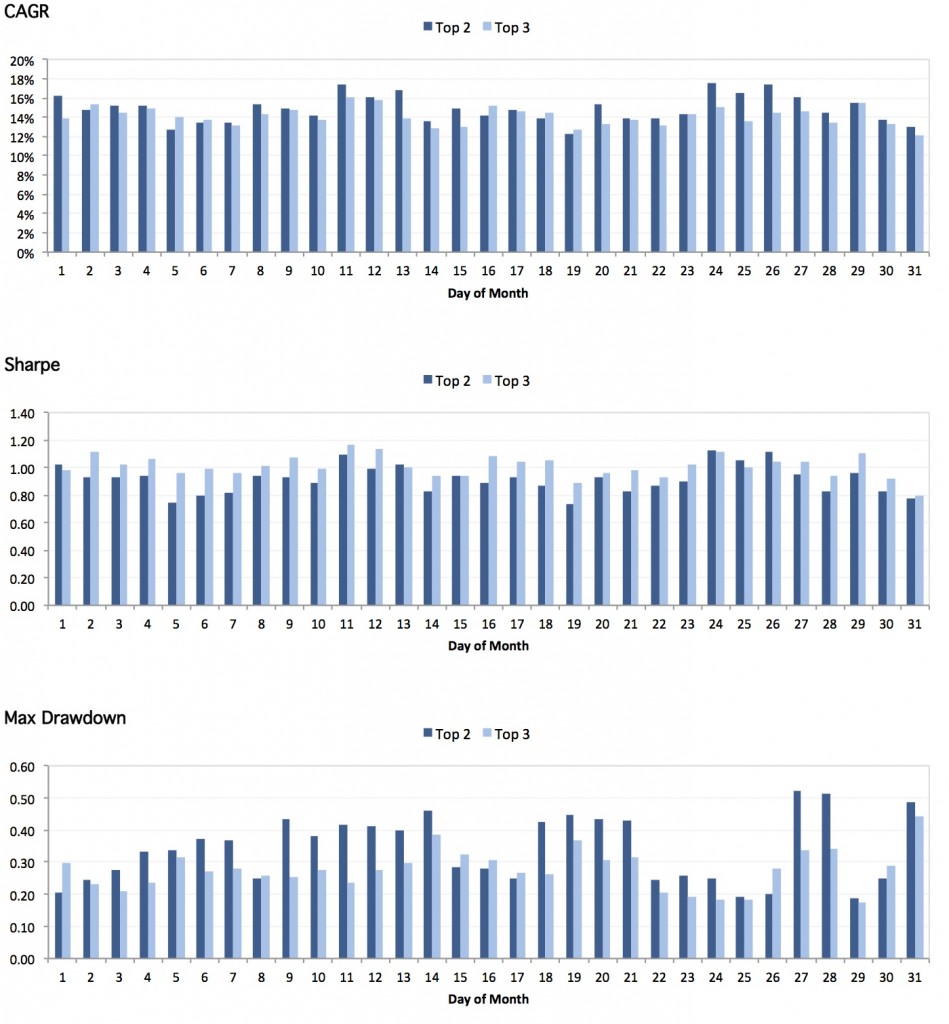
Figure 1. shows the performance for simple top 2 and top 3 global asset class momentum strategies (6 month lookback period) traded on different days of the month. Trades were executed at the close of the day after signals were generated (t+1). We rotated among the following 10 assets, which we extended back to 1995 using index data: DBC,EEM,EWJ,GLD,IEF,IYR,RWX,TLT,VGK and VTI. Assets were held in equal weight for simplicity.
Figure 1. Performance of top 2 and 3 asset momentum systems traded on each day of the month

Source: Data from Bloomberg
Visual inspection might suggest the best trade day of the month for maximum CAGR to be the 11th for both 2 asset and 3 asset systems. Perhaps not surprisingly then, the 11th also delivers the highest Sharpe ratio. The observed Sharpe ratio from trading a top 2 asset system on the 1st day of the following month based on signals from the last day of the month is in the 90th percentile of all observations. Huh.
Interestingly, the 11th is one of the worst days to trade for drawdowns, at least for the 2 asset system, though trading on the 27th and 31st produces the worst drawdowns for 2 and 3 asset systems, respectively. The trade date which produces the smallest drawdowns for both systems is the 25th.
Novice readers may be tempted to believe that, if they stick to trading on the first day of the month based on signals from the last day, they will continue to generate better results than if they trade on different days. Others may want to switch their monthly trade date to the date which has historically optimized Sharpe ratio or returns. We would urge you to resist these temptations. While some may claim that structural effects like institutional position squaring may provide stronger signals toward the end of the month, there is no evidence in the data that supports this conclusion. It is almost certainly just more random noise.
Rather than using this information to change trade dates, we would encourage you to alter your expectations instead. One way to manage expectations is to expect performance near the middle of, or nearer the bottom of, the historical performance distribution. Figure 2 describes the quantiles of performance across all trade dates for the two systems under investigation.
Figure 2. Quantile performance of top 2 and top 3 asset 6-month momentum systems across days of the month
 Source: Data from Bloomberg
We would guide expectations toward 5th percentile values because in practice, if performance exceeds the 5th percentile “line in the sand,” it is reasonable to believe that the strategy is performing within the distribution of its expected returns. If it delivers persistent performance below this level it might be fair to wonder if there is a genuine flaw in the investment methodology. For example, if you are contemplating trading a simple monthly 3-asset momentum system with 6-month lookback horizon, you might expect a Sharpe (pre-fees, costs and slippage) of about 0.9, and a maximum drawdown of about 38%. (For those interested in ways to improve on this simple strategy, may we humbly suggest that you explore our ‘Dynamic Asset Allocation for Practitioners‘ series.)
This might be a hard pill to swallow for novice quants who are applying (or considering applying) a monthly system, but in our opinion it’s better to know the risks in advance. It’s also a reason to test strategies using daily data, as monthly periodicity will dramatically understate risk parameters, especially drawdowns. Candidly, if you are invested in a strategy that trades monthly based on a monthly backtest or even a real-time track record, you are probably taking considerably more risk than you think.
The post Setting Expectations for Monthly Trading Systems appeared first on GestaltU.
Source link