


In this week's edition of the SIA Equity Leaders Weekly, we are going to revisit two key Commodities: Copper and Silver. Both of these Commodities have underperformed versus other Commodities in the last year and continue to show signs of weakness, adding pressure to those equities that benefit or prosper from their pricing. Copper has dropped to a 44-month low, while Silver has had a better start to 2014 (up ~7.7%), but still has dropped in value by over 27% in the last 12 months.
Copper Continuous Contract (HG.F)
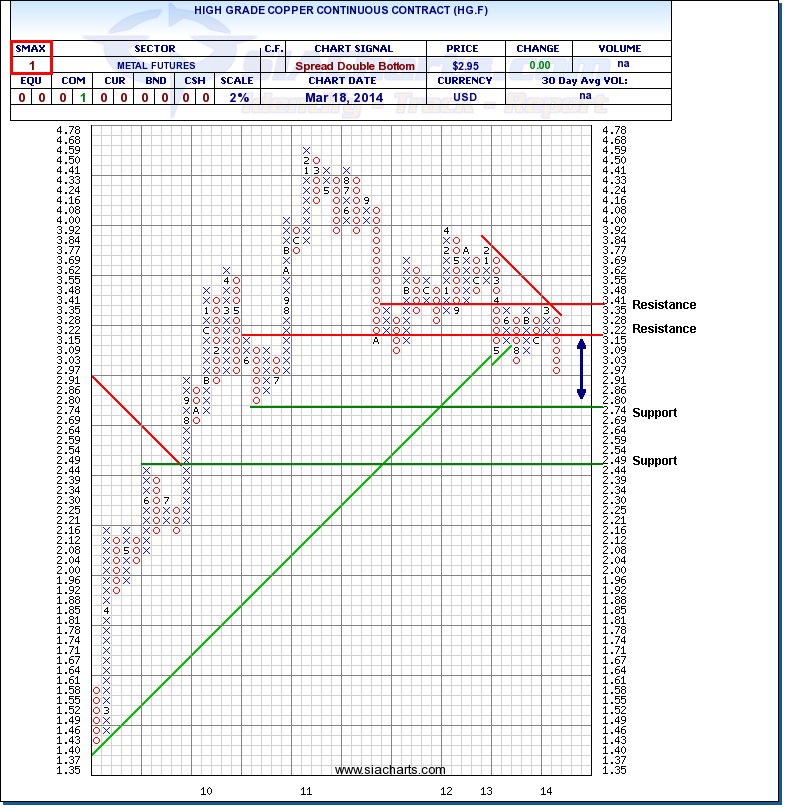
The Copper Continuous Contract (HG.F) has continued to fall over the last couple of weeks from international tensions affecting this imporant industrial commodity. The near-term strength score for Copper has dropped to an SMAX score of 1 out of 10 versus other asset classes with the first support level found above $2.74. Further support should this weakness continue is found at $2.44.
After trading mostly range bound between $3.00 to $3.41 over the past year, resistance above is found at $3.22 and at $3.41 should it reverse. The downwards trend line has also moved down providing more resistance in the $3.35 range.
Copper continues to be an underperforming Commodity showing relative weakness when comparing other Commodity Futures or ETFs as it is currently found (and has been for the past 13 months) in the UnFavored zones of all the Commodity reports within SIA. Copper has been the worst performer among metals this year with the S&P GSCI Copper Index down 8% this month and 11.8% in 2014.
Click on Image to Enlarge
Silver Continuous Contract (SI.F)
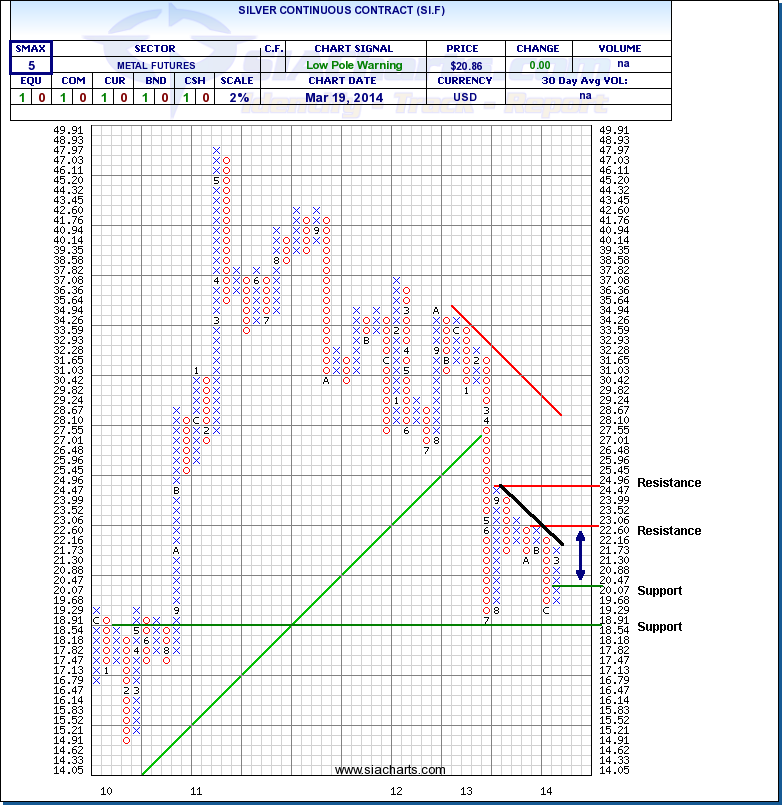
Silver Continuous Contract (SI.F) has had a more positive start to 2014 than Copper, but is still showing some near-term weakness versus other asset classes with an SMAX score of 5 out of 10. Should the short-term strength continue, resistance is found above at $23.06 with further resistance in the $24.96 area. To the downside, support is found above $20.07 and below this at $18.54.
Similar to Copper, when looking at Silver's rank versus other Commodity alternatives, it is showing relative weakness and is found in the UnFavored zone of all the Commodity reports within SIA. A black line shows the slope of the trend moving downwards. So although Silver is positive YTD, it continues to slope downwards in the long-run. Silver (SI.F) has seen over a year and a half period now where it has had lower lows and hasn't had higher highs from the prior move on a Point and Figure 2% chart.
Click on Image to Enlarge
SIACharts.com specifically represents that it does not give investment advice or advocate the purchase or sale of any security or investment. None of the information contained in this website or document constitutes an offer to sell or the solicitation of an offer to buy any security or other investment or an offer to provide investment services of any kind. Neither SIACharts.com (FundCharts Inc.) nor its third party content providers shall be liable for any errors, inaccuracies or delays in content, or for any actions taken in reliance thereon.
Copyright © SIACharts.com


