Recognizing value as a risk factor of significance is firmly established in the academic literature and it’s widely applied in the real world of money management. It’s not hard to understand why. Buying assets on the cheap has an encouraging history of delivering the performance goods, and there's quite a lot of theoretical support for explaining why that's so. The problem, of course, is that deciding if a given asset or asset class is priced at a discount is tricky in real time. One reason is because the traditional metrics of choice for estimating value—book value, earnings, and other accounting measures—are reported with a considerable time lag. Even worse, some asset classes (i.e., commodities) can’t be valued properly, if at all, by the cash-flow standards that apply to stocks, bonds and real estate. Value investing, in other words, requires a fair amount of time and effort. But in a bid to generate real-time value signals that can supplement the traditional methods, a recent paper offers an intriguing idea: look to Mr. Market’s price signals for guidance.
A study (pdf) in the June 2013 issue of The Journal of Finance notes that calculating measures of value is "difficult because not all asset classes have a measure of book value." One way around this challenge is looking to variations on computing five-year price changes, according to the authors of "Value and Momentum Everywhere." Where did this idea come from? Actually, it's a concept that's been bubbling in the literature for some time:
These long-term past return measures of value are motivated by DeBondt and Thaler (1985), who use similar measures for individual stocks to identify "cheap" and "expensive" firms. Fama and French (1996) show that the negative of the past 5-year return generates portfolios that are highly correlated with portfolios formed on BE/ME, and Gerakos and Linnainmaa (2012) document a direct link between past returns and BE/ME ratios. Theory also suggests a link between long-term returns and book-to-market value measures (e.g., Daniel, Hirshleifer, and Subrahmanyam (1998), Barberis, Shleifer, and Vishny (1998), Hong and Stein (1999), and Vayanos and Wooley (2012)).
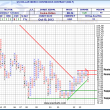
Using this research history as a guide, let’s review how the US stock market (S&P 500) compares in terms of rolling 5-year price returns vs. a widely accepted measure of value—the Cyclically Adjusted Price-Earnings Ratio (CAPE), which is based on average inflation-adjusted earnings over a rolling 10-year window. (CAPE, by the way, has been popularized in recent years by Yale Professor Robert Shiller, one of three economists who won the Nobel prize in finance this week.)
The chart above reminds that these two measures of value track one another fairly closely at times, although each has a tendency to go its own way for extended periods. That’s a message that 5-year price return is no substitute for CAPE. But it’s also clear that a 5-year price return does a reasonable job of telling us, in real time, when stocks are highly valued, or priced at a significant discount, or something in between. When the 5-year price return’s signal is in agreement with CAPE’s message, the overall profile is especially convincing. That was certainly true in the late-1990s, when both metrics flashed warning signs that implied that equities were trading at excessive valuations. On the flip side, CAPE and the 5-year return were in agreement that stock valuations looked unusually meager in late-2008 and early 2009. In fact, both metrics bottomed out in March 2009, which marks the start of the latest bull-market run.
Should you replace CAPE and other fundamental measures of value with a rolling 5-year performance measure? No, but you can and probably should complement conventional price-earnings, price-to-book metrics, etc. with a performance-based estimate of value. We can debate if 5-year return windows are optimal vs., say, 10 year or 4.5 years. In any case, given how easy it is to generate 5-year return numbers (or something you deem appropriate), why wouldn’t you regularly look at this metric as a quick proxy for deciding if deeper value analysis is timely?
In fact, there’s a strong case for routinely crunching rolling 5-year returns on all the major asset classes as a first cut for monitoring how the outlook for the value factor stacks up. Part of the motivation here comes from recognizing that strong value-oriented buying or selling opportunities (especially on an asset class level) are relatively rare. As a result, research efforts should be focused elsewhere… most of the time. Where? The title of the paper noted above offers one idea. Indeed, "Value and Momentum Everywhere" neatly sums up two of the more productive factors that drive quite a lot (most?) of what’s reported as risk premia in the wider world.
The good news is that it’s easy to keep an eye on the momentum and value factors by monitoring prices. In fact, as "Value and Momentum Everywhere" demonstrates, both risk factors resonate across and within asset classes through time. In addition, the correlation between these two risk factors tends to be fairly low, which suggests that targeting both risk factors is complementary and so this approach lays the foundation for a stronger, more diversified portfolio strategy.
The bottom line: much of what's marketed as skill, talent or just plain dumb luck can be traced back to some combination of value and/or momentum. These are hardly the only risk factors in the money game, but they're certainly on the short list of variables to consider for analyzing investment strategies and markets. The fact that you can easily keep an eye on both of these drivers of risk premia to a degree via prices only sweetens the deal.
Copyright © Capital Spectator