Yesterday I wrote about how this rally off the August 27th low had good breadth, a bullish tailwind for the market.
I continue to see other bullish indications. Looking at several risk-on/risk-off measures, the bias continues to be risk-on.


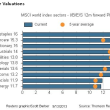
 Source: Stockcharts.comShown above, small-caps have maintained their uptrend in outperforming larger-caps, high-yield bonds have done the same versus T-bonds, and likewise cyclical stocks continue to do better than staples, recently hitting a new relative high. The bottom line is riskier assets have been outperforming their safer, more conservative brethren, generally a bullish setting for the market.The daily chart below shows that while the uptrend for the market remains intact, it has started to level off a bit, with trend lines tilting more horizontal.
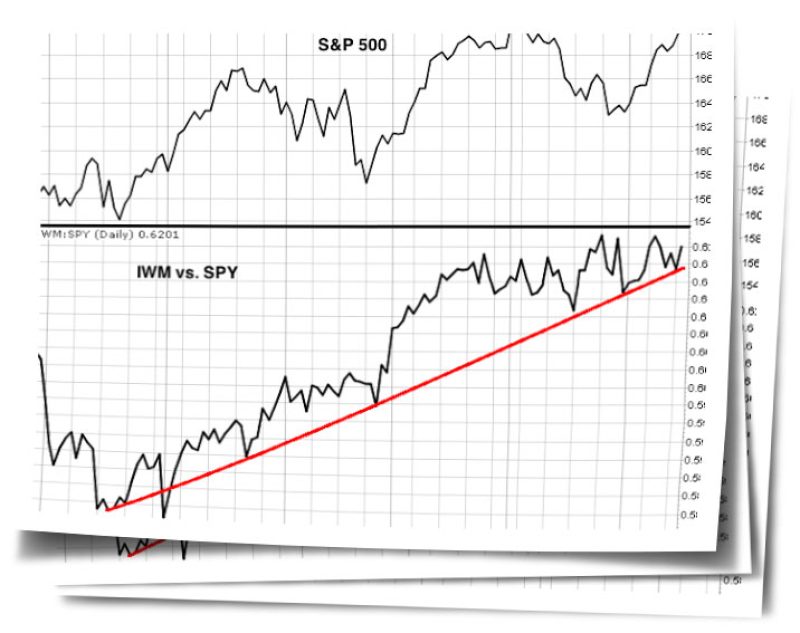
 Source: Stockcharts.comNothing overly worrisome and is a natural occurrence with a maturing advance. Note that the MACD triggered a buy signal earlier this month and the stochastic, while overbought, is extreme and beginning to traverse sideways at this extended level -- signs of "good overbought" development (see red boxes for past examples, price continues to rise).Based on what I follow, the market currently has many things in its favor, however I do want to see the S&P 500 successfully get through the prior high level of 1710. As shown in the chart above, we're not quite there yet, and as always I'd want to see a meaningful breakout, i.e. not just getting to 1710-1711 but rather beyond 1712.A concern I have has to do with seasonality. I wrote late last month, "I would argue that since May 1st, the S&P 500 has more or less tracked the seasonal averages directionally. Note that all three seasonal lines show the S&P 500 rising from the end of August and peaking out not long after mid-September." In that time, the S&P 500 has indeed risen by a bit more than 4%, again following seasonal tendencies.But, as shown in the chart below, on average the next few weeks have been rough ones for the market.
 Source: BloombergJudging from the 5- and 10-year average performance lines for the S&P 500, the Index has tended to peak out and decline from mid-September to about mid-October. And as already mentioned, the Index has more or less directionally followed the seasonal script up to this point (purple line), particularly in the last few months.I would point out that 2008 can dramatically impact the calculation of these seasonal studies. From 9/19-10/10 in 2008, the S&P 500 plunged by a whopping -28%, which greatly skews the 5-year and, to a lesser extent, the 10-year averages. In the chart below, I show the 5-, 10- and 30-year averages for the S&P 500 from mid-September to the end of October, but I also show a 10-year average without the year 2008 (blue line).
 Source: BloombergEven after excluding 2008, the general trend for the market tends to be down over the next few weeks.Of course, if the S&P 500 does successfully get through the 1710 level, doing so meaningfully with some force, I would have to think such an occurrence would go a long way towards negating this seasonal headwind. However, that hasn't happened yet and until it does the seasonal charts above will be at the forefront of my mind.