by Don Vialoux, Tech Talk
Upcoming US Events for Today:
- No Significant Events Scheduled
Upcoming International Events for Today:
- Japan All Industry Activity for May will be released at 12:30am EST. The market expects a month-over-month increase of 1.2% versus an increase of 0.4% previous.
- Canadian Consumer Price Index for June will be released at 8:30am EST. The market expects a year-over-year increase of 1.2% versus an increase of 0.7% previous.
Recap of Yesterday’s Economic Events:
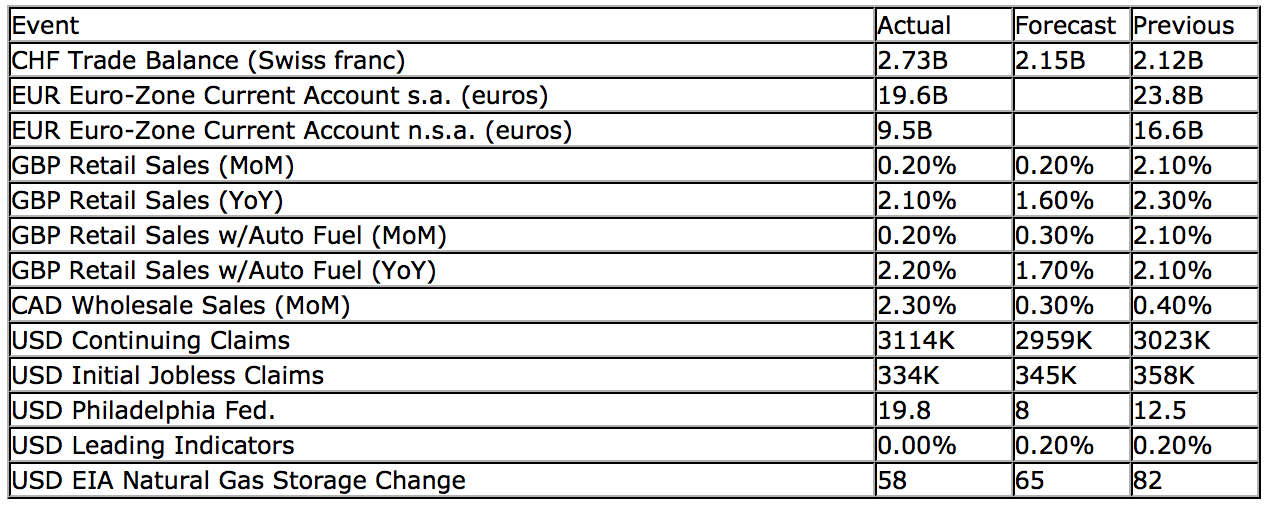
The Markets
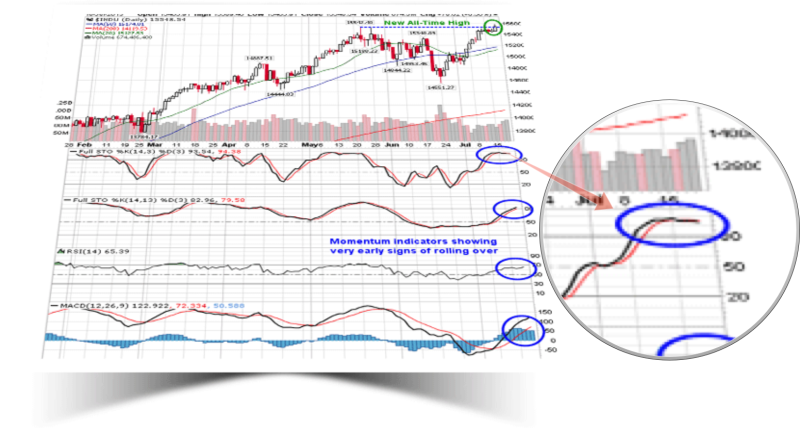
Equity markets pushed higher on Thursday following upbeat economic and earnings data. Initial jobless Claims dropped to one of the lowest levels of the year and the Philly Fed Index jumped to the highest level in well over a year, improvement for each that is not seasonally typical during the mid-summer . Three stocks accounted for all of the gains (and then some) for the Dow Jones Industrial Average; International Business Machines (IBM) and UnitedHealth (UNH) traded firmly higher following earnings beats, while Boeing (BA) rebounded as investors became aware that the company had a fix to last week’s Dreamliner 787 fire. The result was enough to push the Dow to new all-time highs, an achievement shared by the S&P 500, Dow Jones Transportation Average, and Russell 2000. Momentum indicators for each continue to show very early signs of rolling over, providing indication that the stellar four-week rally may be maturing.


As momentum indicators for equity benchmarks show signs of rolling over, technical indicators for treasury yields have already confirmed signs of peaking. The yield on the 10-year note just broke below the rising trendline that originated back at the beginning of May, suggesting a change of trend (obviously). The 14-day Relative Strength Index for the 10-year yield had recently become the most overbought since mid-2007, just prior to a significant move lower in rates throughout the months that followed. Yields are approaching a key long-term declining trendline that stretches back to 2008 as the cost of borrowing corrects from the near parabolic move realized in 2011 and 2012. Yields seasonally decline between now and the beginning of October.


 Seasonal Chart")
Seasonal charts of companies reporting earnings today:


Sentiment on Thursday, as gauged by the put-call ratio, ended overly bullish at 0.74. Investor complacency is now being implied, putting equity markets at risk for possible shock events.

S&P 500 Index


TSE Composite


Horizons Seasonal Rotation ETF (TSX:HAC)
- Closing Market Value: $13.62 (up 0.22%)
- Closing NAV/Unit: $13.62 (up 0.14%)
Performance*
| 2013 Year-to-Date | Since Inception (Nov 19, 2009) | |
| HAC.TO | 7.08% | 36.2% |
* performance calculated on Closing NAV/Unit as provided by custodian
Click Here to learn more about the proprietary, seasonal rotation investment strategy developed by research analysts Don Vialoux, Brooke Thackray, and Jon Vialoux.