by Don Vialoux, TechTalk
Pre-opening Comments for Tuesday July 9th
U.S. equity index futures were higher this morning. S&P 500 futures were up 6 points in pre-opening traded. Index futures are responding partially to slightly better than consensus second quarter operating earnings reported after the close. Alcoa added $0.06 to $7.98
June Canadian Housing Starts were better than expected. Consensus was a decline to 187,000 from 200,200 in May. Actual was 199,586.
Barrick Gold added $0.32 to $14.11 despite a downgrade by Stiffel Nicolaus from Buy to Hold. The stock is responding to higher overnight gold prices
Wells Fargo slipped $0.02 to $42.81 after Susquehanna downgraded the stock from Positive to Neutral.
IBM fell $2.97 to $192.01 after Goldman Sachs downgraded the stock from Buy to Neutral. Target was lowered from $220 to $200.
Hewlett Packard added $0.22 to $25.39 after Brean Capital upgraded the stock from Hold to Buy. Target is $32.
Dupont (DD $53.76) is expected to open lower after Macquarie downgraded the stock from Outperform to Neutral. Target is $57.
Interesting Article In Yesterday’s www.globeandmail.com
(Authored by Tech Talk)
Headline reads, “It’s time to reduce your equity exposure to market sensitive ETFs” Following is link to the report:
This article as well as the next article suggests that investors have an opportunity to take trading profits in market sensitive equity indices and their related ETFs between now and next week.
Interesting Article In The Latest Edition Of www.StockCharts.com ’s ChartWatchers Newsletter
Headline reads, “S&P 500 Warning Signs Emerging for summer – Again”. Included in the report is an observation that the S&P 500 Index has a history of moving higher from July 1st to July 17th. Data for 62 years shows that the S&P 500 Index has gained an average annualized return of 21.48% per period followed by an average annualized return of -2.04% per period from July 17th to September. Tom Browley, author of the report, suggests that history is repeating this summer. The report confirms a comparable study published in Thackray’s 2013 Investor’s Guide showing that the S&P 500 Index has a history of moving higher 71% of the time from July 1st to five trading days following U.S. Independence Day. Brooke’s book also includes a report showing that the S&P 500 Index has a history of outperformance during the first 18 calendar days in the month when quarterly earnings reports are launched.
Following is a copy of Tom Bowley’s report:
S&P 500 WARNING SIGNS EMERGING FOR SUMMER – AGAIN
by Tom Bowley | InvestEd Central
In the very near-term, it’s difficult to predict which way the S&P 500 is heading. Recently, we saw the Volatility Index ($VIX) spike to nearly 22 and the multi-month uptrend line on the S&P 500 was violated. Take a quick look:

The biggest technical issue wasn’t necessarily the VIX rising to 22 as we saw it move above that level in late December 2012. Instead, breaking that 5-6 month trendline that already had four successful tests was the bigger story. In my view, it changed the "cloudy" outlook for equities from a short-term concern to a more intermediate-term issue. It also happened just as we approach the worst 2-3 consecutive months of the year historically.
Here are the historical numbers – you decide if they’ll impact trading in the next few months:
S&P 500 annualized return since 1950:
- July 1st through July 17th: +21.48%
- July 17th through September 28th: -2.04%
Since 1950, that July 17-September 28 period has covered 3140 trading days, or roughly 12.4 years worth of data. That’s a lot of data and certainly should be considered a "representative sample" by statisticians. And it trails the AVERAGE annual return of the S&P 500 by more than 10 percentage points. Based on these FACTS, there is no doubt that the market has an historical "tendency" (not a guarantee) to struggle throughout this period, some years much worse than others.
Why else should we be concerned? Well, let’s take a look at the weekly chart of the S&P 500:

Check out the black circles on the chart above. It shows that over the past decade, we’ve seen a handful of times where the weekly PPO (percentage price oscillator – similar to the MACD, but expressed in percentages rather than dollars) is stretched to the 3-4 level and the weekly RSI hits 70 (overbought) simultaneously. In every case, we’ve seen selling take us AT LEAST to rising 50 week SMAs over the next 2-3 months. To be honest, it makes perfect sense. A stretched PPO tells us that the market has been running HOT for an extended period of time and the overbought RSI confirms it. A pullback really is to be expected.
But before you go running for the hills, you should also realize that key sectors/industries are performing exceptionally well on a relative basis, suggesting the longer-term bull market remains intact.
So what does all this mean? Well, it tells me that short- to intermediate-term risks are rising if you’re on the long side. I combat that by trading less often and fewer shares. You can further reduce risk by selling calls or buying put insurance on the S&P 500.
Please don’t misunderstand my overall view, however. I remain BULLISH over the longer-term (6-9 months) but realize the market is likely to continue its recent choppy pattern, perhaps turning more bearish later this summer. I believe we’ll see 1530 on the S&P 500 at some point over the summer, possibly even the 1465-1485 area. I do not plan to short, however, as these levels are not guarantees and as I said before, I remain bullish in the longer-term.
My Chart of the Day for Monday highlights a few of the reasons for my bullishness later in 2013. You can CLICK HERE for details.
Happy trading!
Tom Bowley
Chief Market Strategist
Invested Central
Interesting Charts
Bullish sentiment prior to the release of second quarter reports prompted selected indices and sectors to touch all-time highs yesterday including the Russell 2000 Index and three consumer related sectors.


FP Trading Desk Headline
FP Trading Desk headline reads, “Base metal stocks in trouble as China outlook weakens”. Following is a link to the report:
http://business.financialpost.com/2013/07/08/base-metal-stocks-in-trouble-as-china-outlook-weakens/
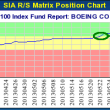
Special Free Services available through www.equityclock.com
Equityclock.com is offering free access to a data base showing seasonal studies on individual stocks and sectors. The data base holds seasonality studies on over 1000 big and moderate cap securities and indices. Notice that most of the seasonality charts have been updated recently.
To login, simply go to http://www.equityclock.com/charts/
Following is an example:
APC Relative to the S&P 500 |
APC Relative to the Sector |
Disclaimer: Comments and opinions offered in this report at www.timingthemarket.ca are for information only. They should not be considered as advice to purchase or to sell mentioned securities. Data offered in this report is believed to be accurate, but is not guaranteed.
Don and Jon Vialoux are research analysts for Horizons Investment Management Inc. All of the views expressed herein are the personal views of the authors and are not necessarily the views of Horizons Investment Management Inc., although any of the recommendations found herein may be reflected in positions or transactions in the various client portfolios managed by Horizons Investment Management Inc
Horizons Seasonal Rotation ETF HAC July 8th 2013

Copyright © TechTalk