


For this weeks edition of the SIA Equity Leaders Weekly, we will update our outlook on the Canadian Equity market looking specifically at the channel the TSX Composite has been in for the last 21 months and comparing the Canadian Equity index to the U.S. Equity index to see if the relative strength relationship has changed.
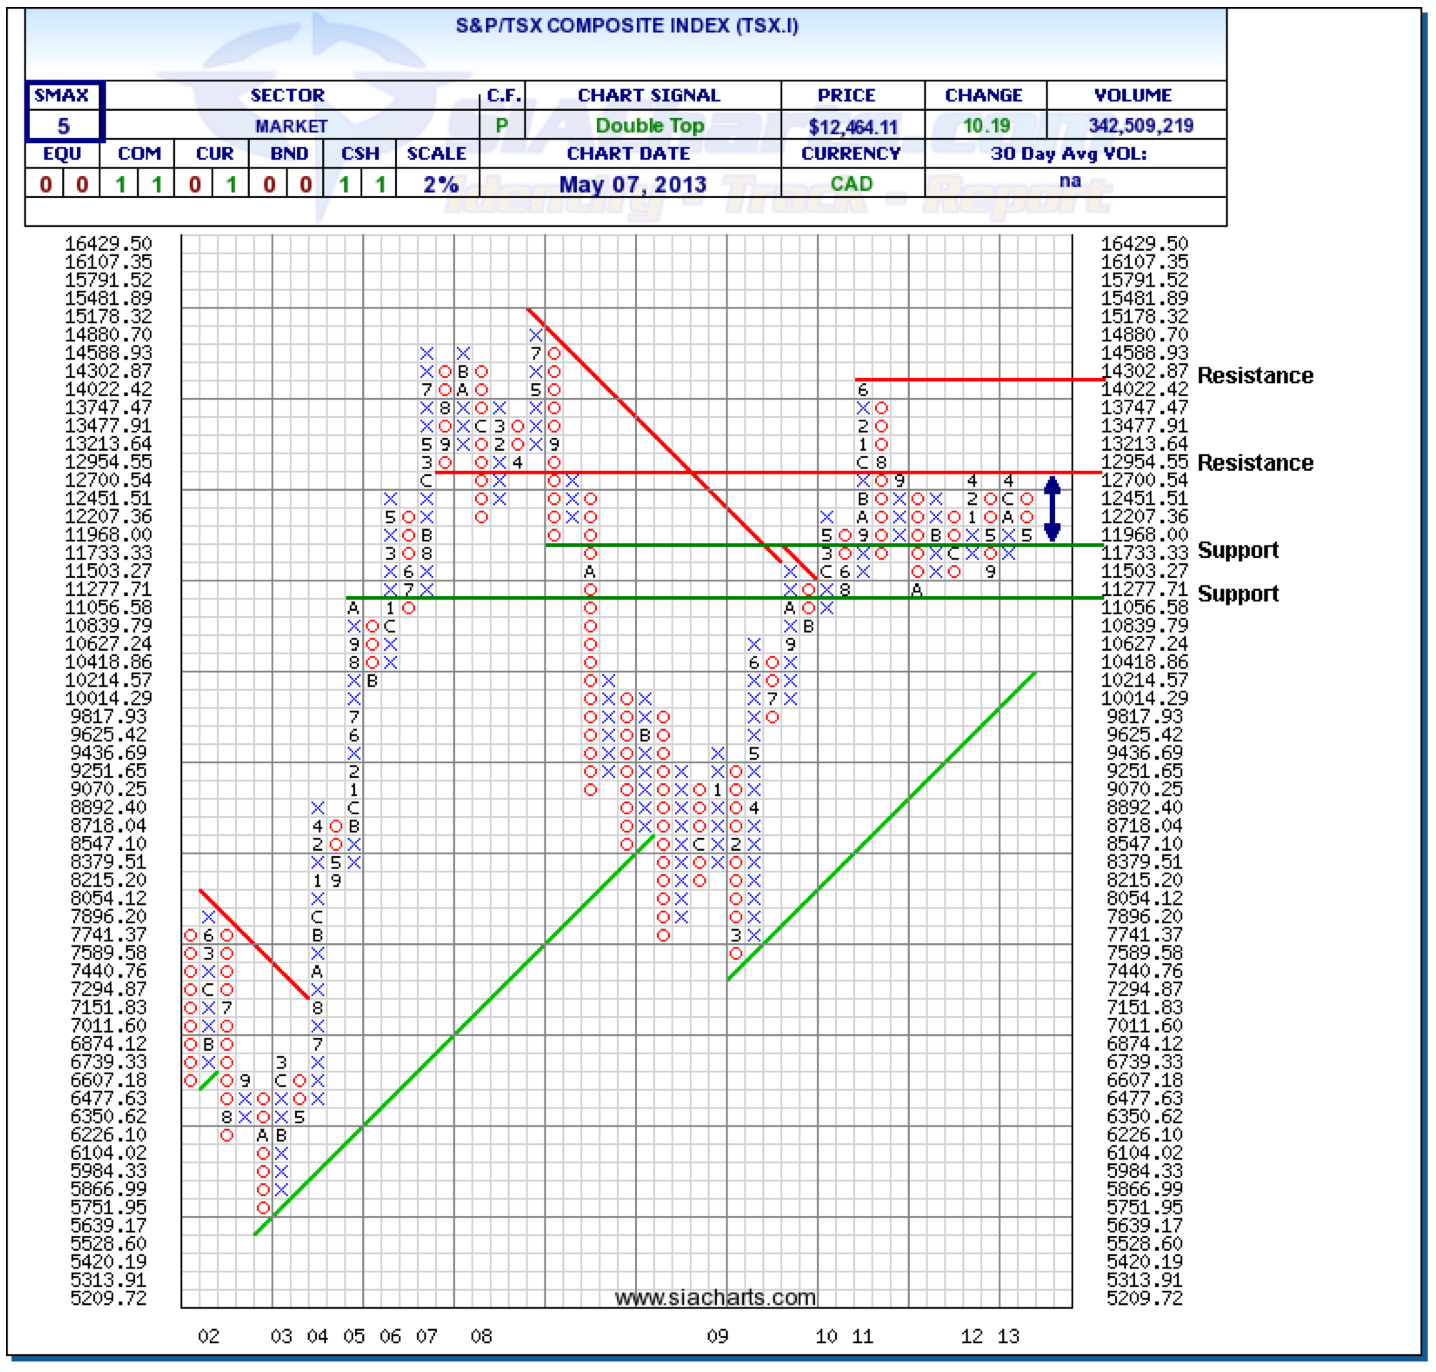
S&P/TSX Composite Index (TSX.I)
Updating the S&P/TSX Composite Index since we last looked at it a quarter ago on Valentines Day shows that the TSX.I has actually pulled back to the support level we highlighted at 11733.33, most likely tied to the Commodities sell-off in early April. Below this is further support at 11056.58 should the weakness continue. To the upside, resistance can be found at 12954.55, a level it also failed to move above in April of 2012 and 2013. A break through this level could see some potential upside towards rechallenging the high from June of 2010 at 14302.87.
So while the TSX Composite has been range bound between 11000 and 13000 over the last 21 months with no growth, the U.S. Equity indexes (S&P 500 Composite, Nasdaq, Dow) have all moved on to new all-time highs. With a neutral SMAX (near-term strength) score of 5 out of 10, we continue to monitor closely these asset class comparisons (see comparison below) and if the TSX Composite can break out of the channel it is currently in.
Click on Image to Enlarge
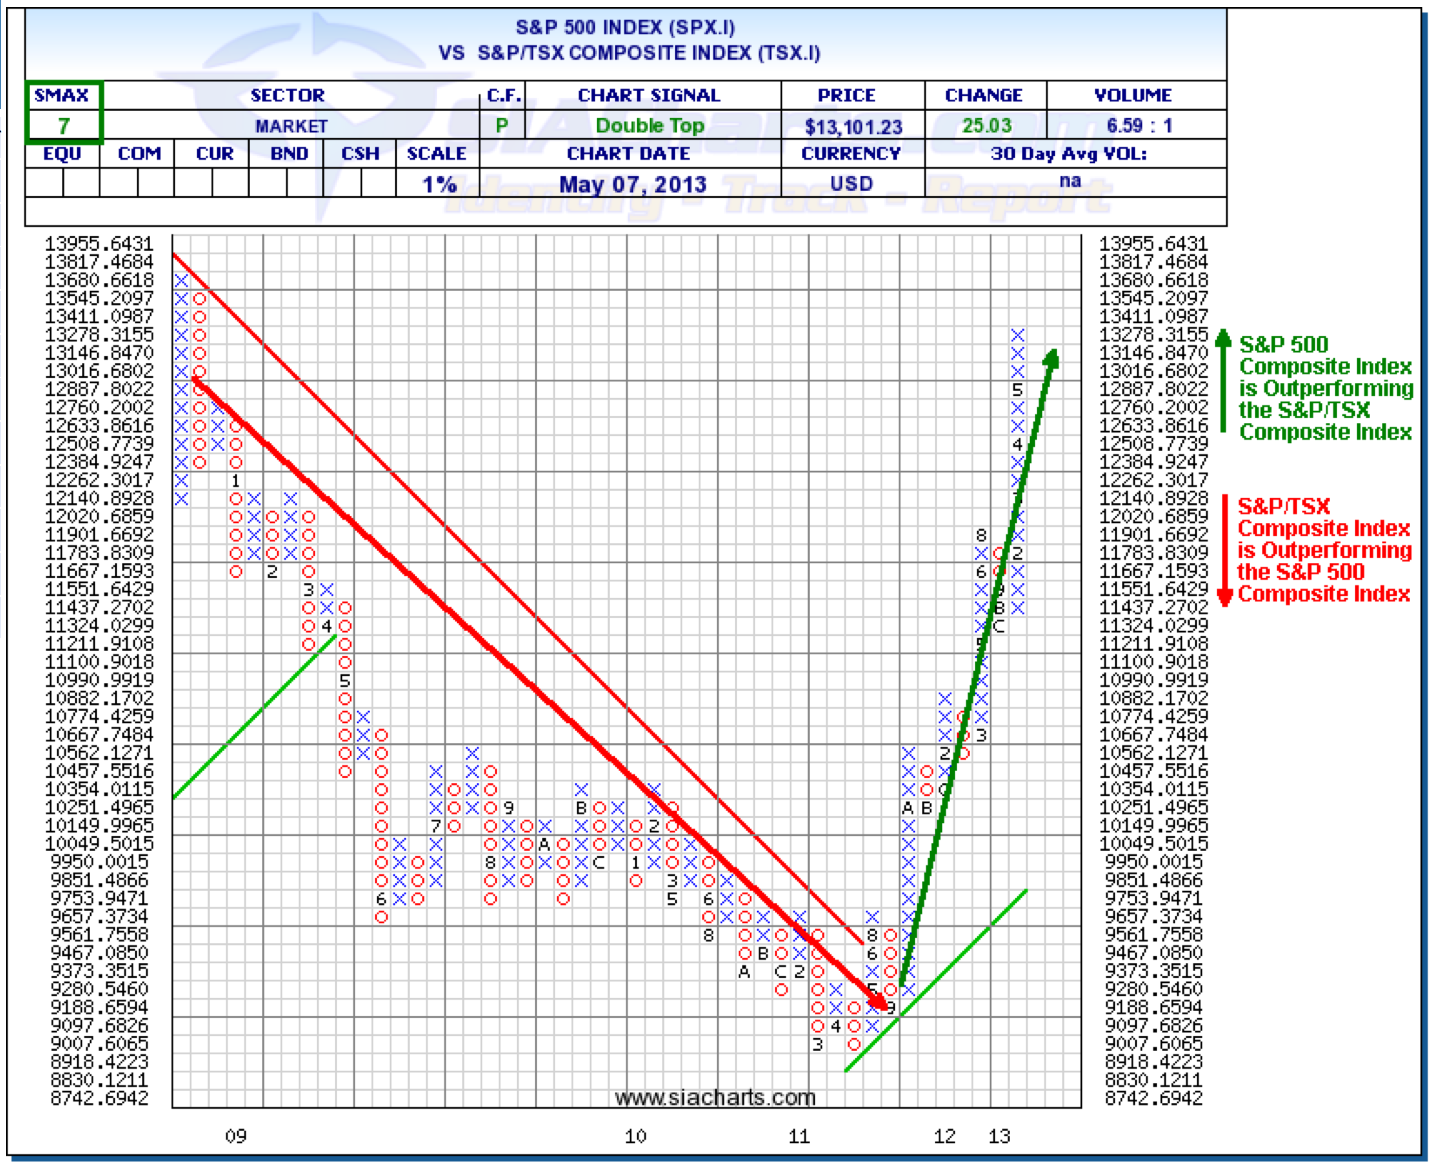
S&P 500 Composite Index vs. S&P/TSX Composite Index (SPX.I vs. TSX.I)
This chart shows the continued outperformance we have seen from the S&P 500 Composite index over the S&P/TSX Composite index with the green arrow showing the relative outperformance since October of 2011. Since the last time we looked at the TSX.I three months ago, the SPX.I has comparatively outperformed by around 10%. If we look at the past 21 months where the TSX.I has been range bound like indicated above, the S&P 500 Index is up around 33% while the TSX Composite is down around 2%. We continue to see relative strength of U.S. Equity over Canadian Equity at this time with the 'VS SMAX' score (comparison score) of 7 in favor of the SPX.I over the TSX.I.
Click on Image to Enlarge
Copyright © SIACharts.com


