by Don Vialoux, Tech Talk
Upcoming US Events for Today:
• NFIB Small Business Optimism Index for January will be released at 7:30am. The market expects 89.5 versus 88.0.
• Treasury Budget for January will be released at 2:00pm. The market expects -$2.0B versus -$0.3B previous.
Upcoming International Events for Today:
• Japan Consumer Confidence for January will be released at 12:00am. The market expects 43.3 versus 39.2 previous.
• Great Britain CPI for January will be released at 4:30am EST. The market expects a year-over-year increase of 2.7%, consistent with the previous report. PPI is expected to show a year-over-year increase of 2.0% versus an increase of 2.2% previous.
• Japan Tertiary Industry Index for December will be released at 6:50pm EST. The market expects a month-over-month increase of 0.7% versus a decline of 0.3% previous.
Recap of Yesterday’s Economic Events:
No significant economic reports released.
The Markets
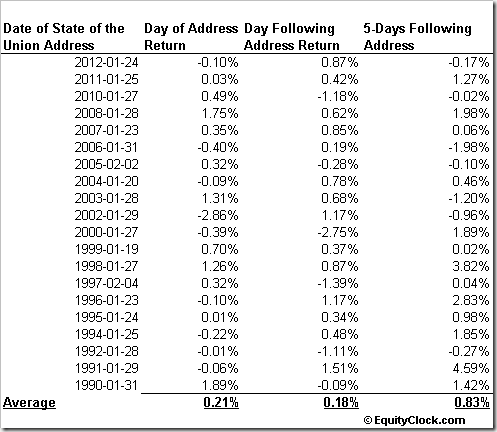
Markets retraced recent gains on Monday an investors refrained from committing to new positions amidst the holidays in Japan and China and ahead of the State of the Union address on Tuesday. Markets in China are closed for the entire week as a result of the lunar new year, the impact of which largely played a role in the volatile trading within commodity markets as buyers failed to accumulate. Investors will be tuned into tonight’s State of the Union Address to get clues as to the direction of jobs, taxes, deficit reduction, and energy. The impact of the address is actually a positive one for the markets. The day of the address, leading up to the speech itself, the S&P 500 has posted an average gain of 0.21% since 1990, positive 55% of the time. The day following the speech when investors react to the president’s comments, gains have averaged 0.18%, slightly less than the day prior, but the frequency of positive results increases to a significant 70%.
Losses exceeding 1% following the speech were recorded in 1992, 1997, 2000, and 2010, while gains exceeding 1% were recorded in 1991, 1996, and 2002. Average gains balloon in the 5 trading days that follow with an average return of 0.83%, positive 58% of the time. What is important to note is that years that produced a loss of 1% or more, average results were flat to positive over the 5-day period to follow, meaning that the one day loss was quickly erased as buyers took advantage of the 1-day dip. If this study is “unexciting” to our readers, perhaps using girls in swimsuits as an indicator will find greater appeal. Bespoke Investment published a study on the Swimsuit Indictor based on the nationalities of the cover models of the Sports Illustrated Swimsuit edition. According to Bespoke, “the Swimsuit Issue Indicator says that the US equity markets perform better in years when an American appears on the cover of Sports Illustrated’s annual issue as opposed to years when a non-American appears on the cover.” You can read more of the “study” via the following link: http://www.bespokeinvest.com/thinkbig/2013/2/11/sports-illustrated-swimsuit-issue-score-another-for-bulls.html.
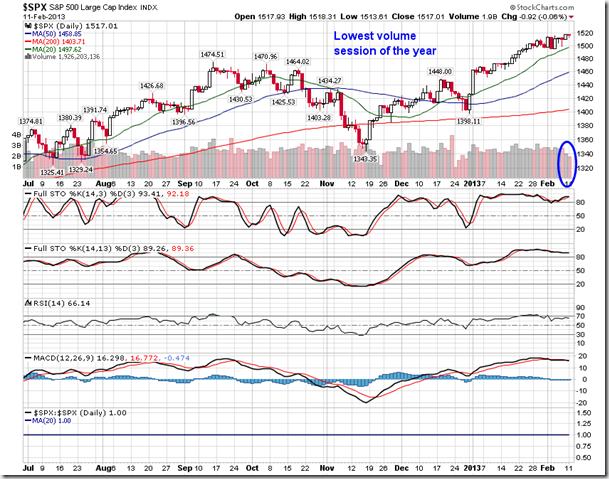
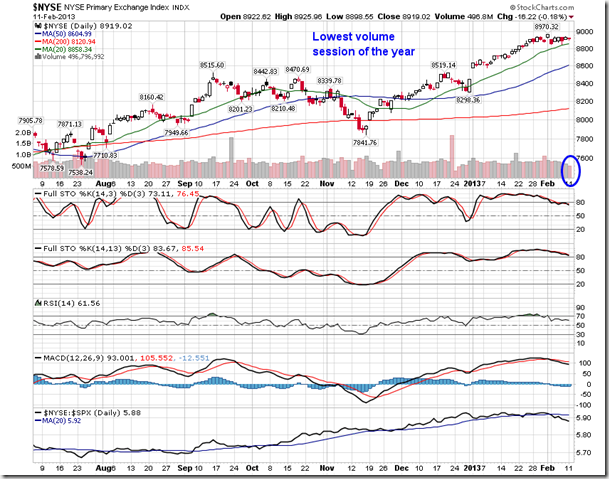
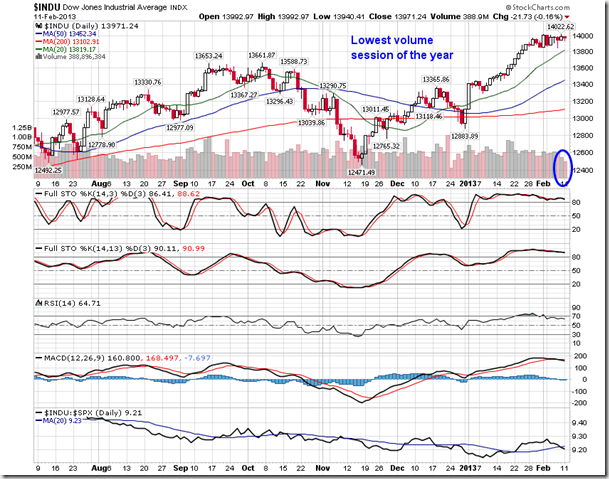
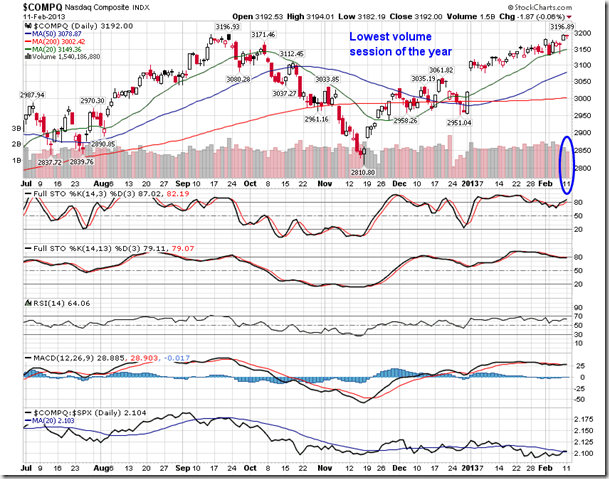
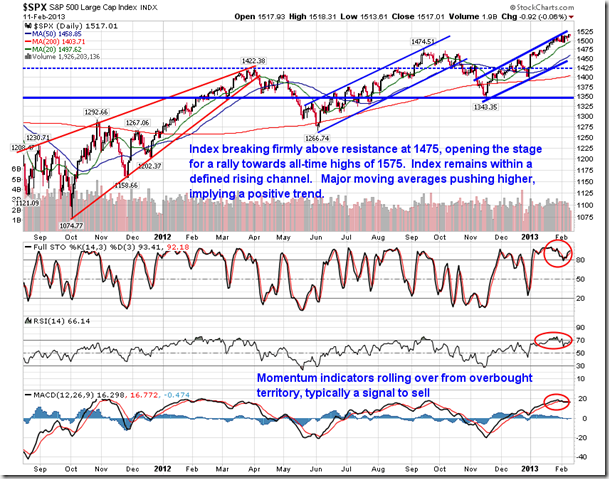
As a result of the holiday’s on Monday in Japan and China, volume on North American indices was extremely light. The S&P 500 Index, NYSE Composite, Dow Jones Industrial Average, and Nasdaq Composite recorded the lowest volume session of the year, making the declines on the session rather insignificant. Each of these benchmarks are holding above and showing support at their respective 20-day moving average, suggesting strength in the short-term.
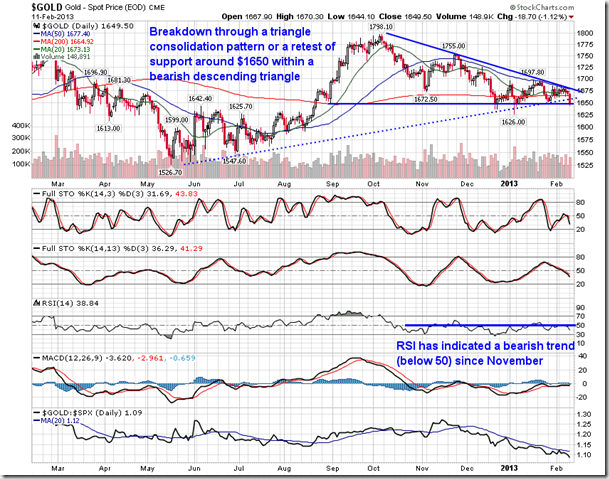
The notable activity on Monday was in the commodity market, which saw a number of metals post losses exceeding 1%. Gold lost 1.12% and analysts have immediately confirmed a breakdown. However, there are a few ways to look at the chart. A triangle consolidation pattern that was bound by a rising trendline (the dotted line in the chart) was broken during Monday’s activity, suggesting a negative move ahead as the bears outweigh the bulls. Another way to look at the chart is that the commodity has come back down to support around 1650, a level that could be implied to be part of a bearish descending triangle pattern, which would target down to long-term support at $1500.
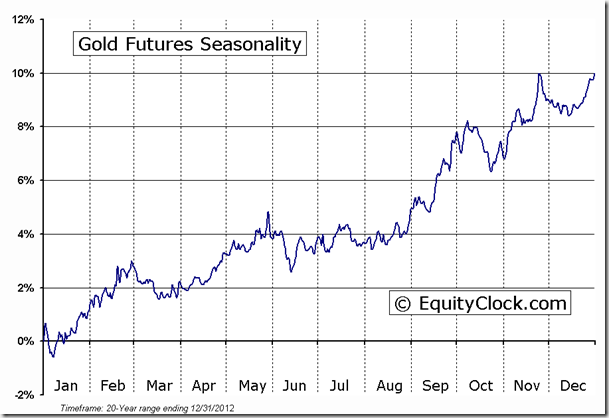
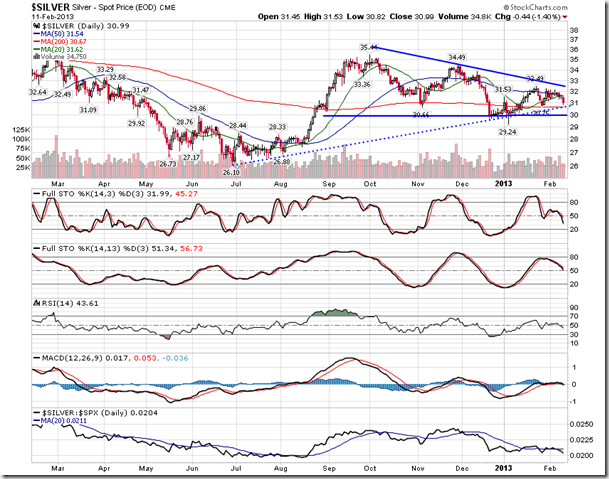
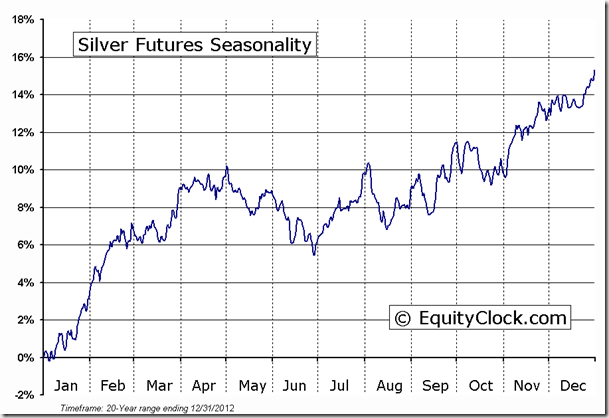
Confirmation of the bearish descending triangle would be achieved upon a definitive breakdown below support at 1650. Until this breakdown is realized, support is the only thing that can be implied. A similar setup is apparent on the chart of Silver, which, although typically benefits from improved industrial demand at this time of year, has reacted more correlated with it’s precious metal cousin, Gold. Silver tested the lower limit of a triangle consolidation pattern on Monday and support remains well below at $30. Still the same bearish setup for this industrial/precious metal applies should support at $30 be broken, despite positive seasonal tendencies that benefit the commodity through to March.
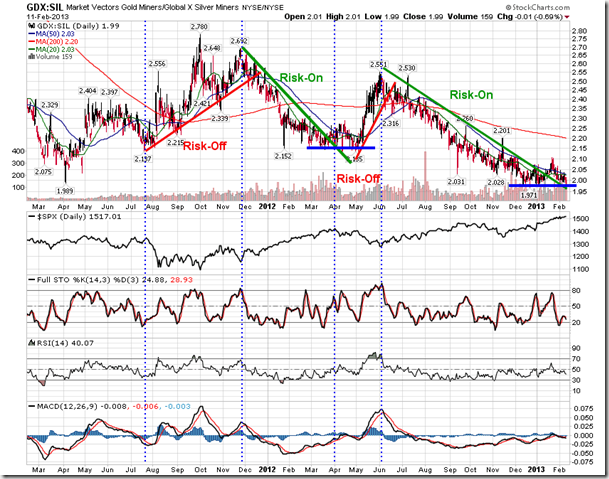
Risk sentiment of investors can often be derived between the relative performance of Gold and Silver, or, more specifically, the relative performance of Gold miners versus Silver miners. When investors are “Risk-On” they prefer silver miners over gold miners. As a result gold miners tend to underperform. When investors are “Risk-Off” they prefer gold miners, which tend to outperform silver miners in such instances. Silver miners have outperformed Gold miners since June of last year, suggesting a risk-on trend. However, recently the relative trend between the two has flattened out, suggesting a bottoming pattern as investors become more risk averse. A similar situation was charted last March/April as the stock market was peaking. This indicator does give rise to concern that the equity markets may be peaking as risk aversion starts to play a role in investor activity.
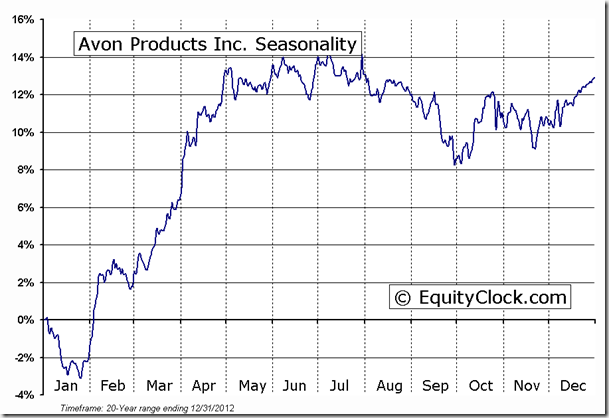
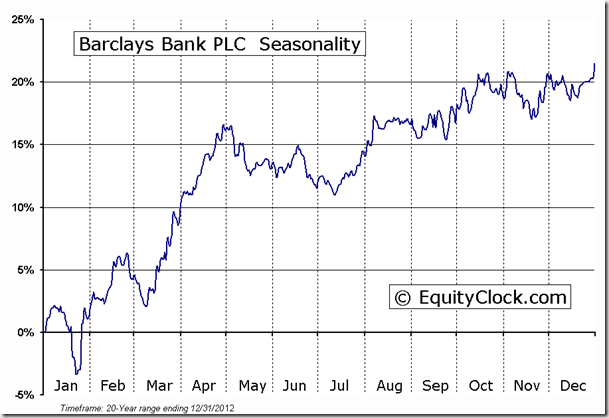
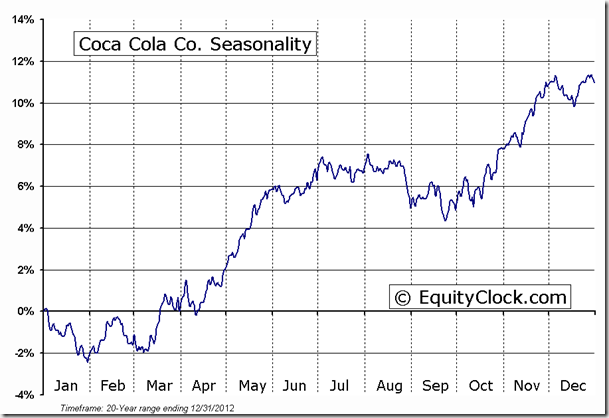
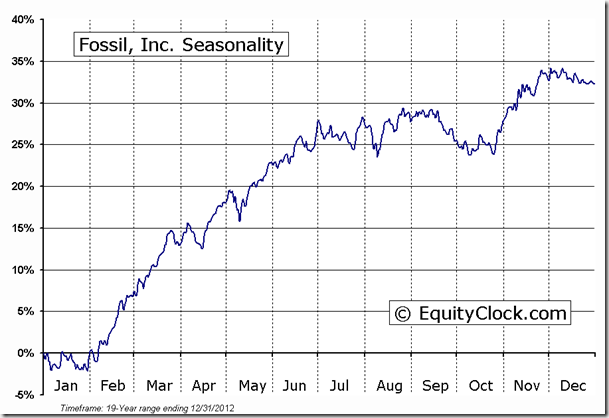
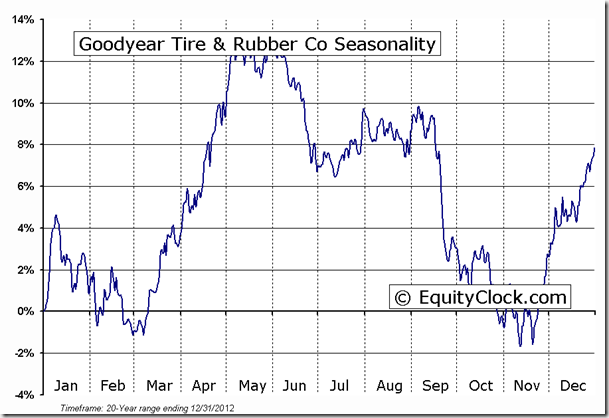
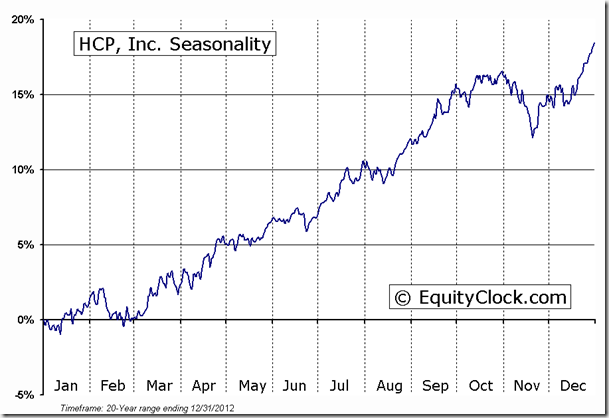
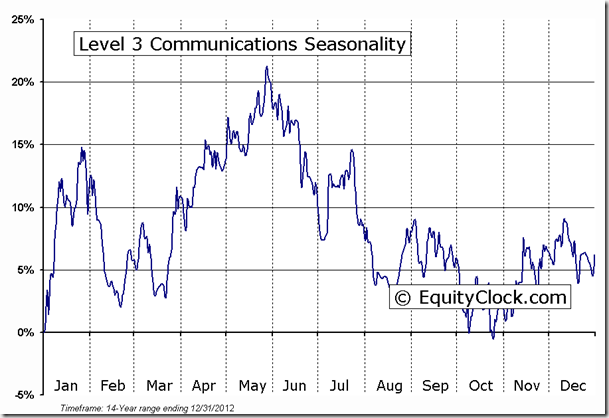
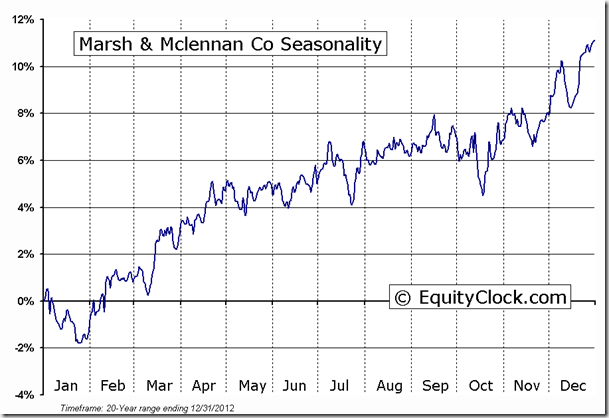
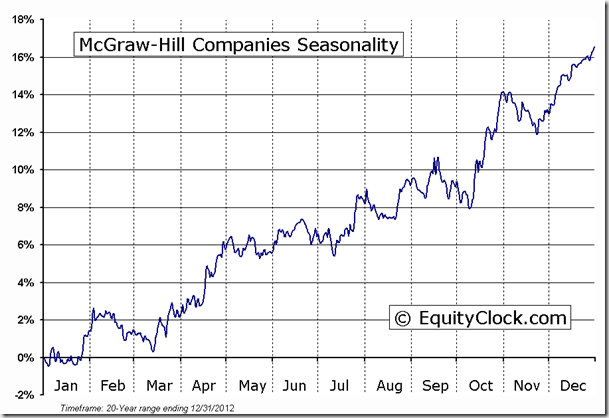
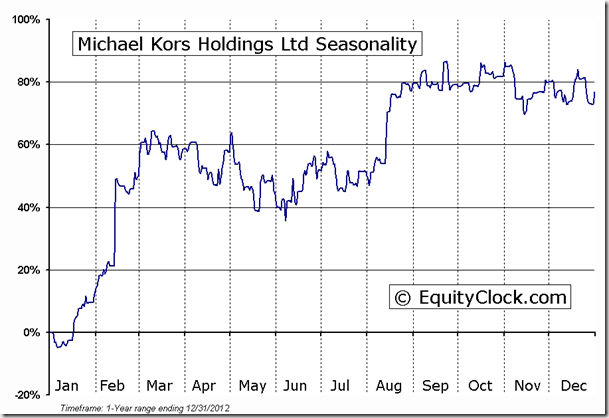
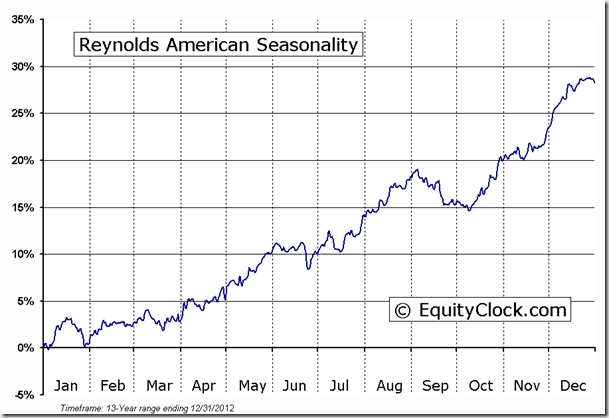
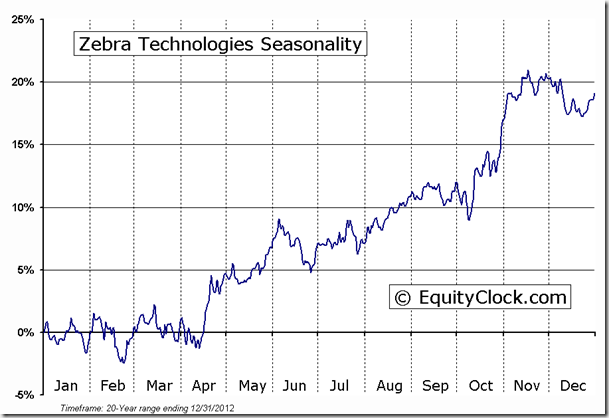
Companies reporting earnings today include Avon Products, Barclays Bank, Coca-Cola Co., Fossil, Goodyear Tire, HCP, Level 3 Communications, March & Mclennan, McGraw Hill, Michael Kors, Reynolds American, TransCanada Corp, and Zebra Technologies.
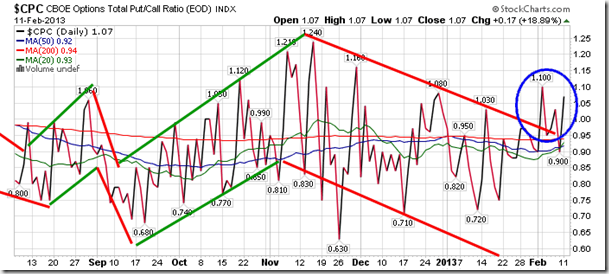
Sentiment on Monday, according to the put-call ratio, ended bearish at 1.07. As noted over the past few days, investor sentiment is showing signs of changing from that of a optimism to that of pessimism as put option volumes start to outpace that of calls, somewhat reiterating the sentiment shift between Gold and Silver minding equities.
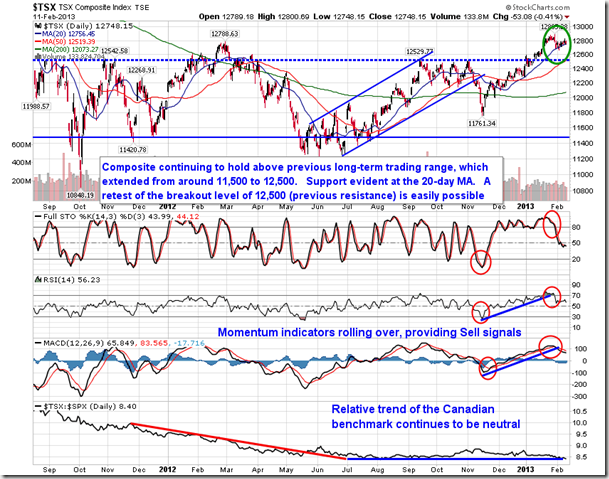
Chart Courtesy of StockCharts.com
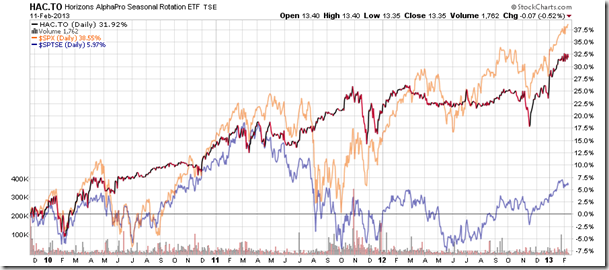
Chart Courtesy of StockCharts.com
Horizons Seasonal Rotation ETF (TSX:HAC)
- Closing Market Value: $13.35 (down 0.52%)
- Closing NAV/Unit: $13.37 (down 0.36%)
Performance*
| 2013 Year-to-Date | Since Inception (Nov 19, 2009) | |
| HAC.TO | 5.12% | 33.7% |
* performance calculated on Closing NAV/Unit as provided by custodian
Click Here to learn more about the proprietary, seasonal rotation investment strategy developed by research analysts Don Vialoux, Brooke Thackray, and Jon Vialoux.
Copyright © Tech Talk


