

February 7, 2013
For this week's edition of the SIA Equity Leaders Weekly we are going to relook at the U.S. Equity markets, specifically the S&P 500 Index to see what we can expect going forward. Also, by looking at an example of how our asset allocation has kept us away from commodities, we can see the positive returns resulted by keeping in assets of strength relative to each other.
S&P 500 Index (SPX.I)
Click on Image to Enlarge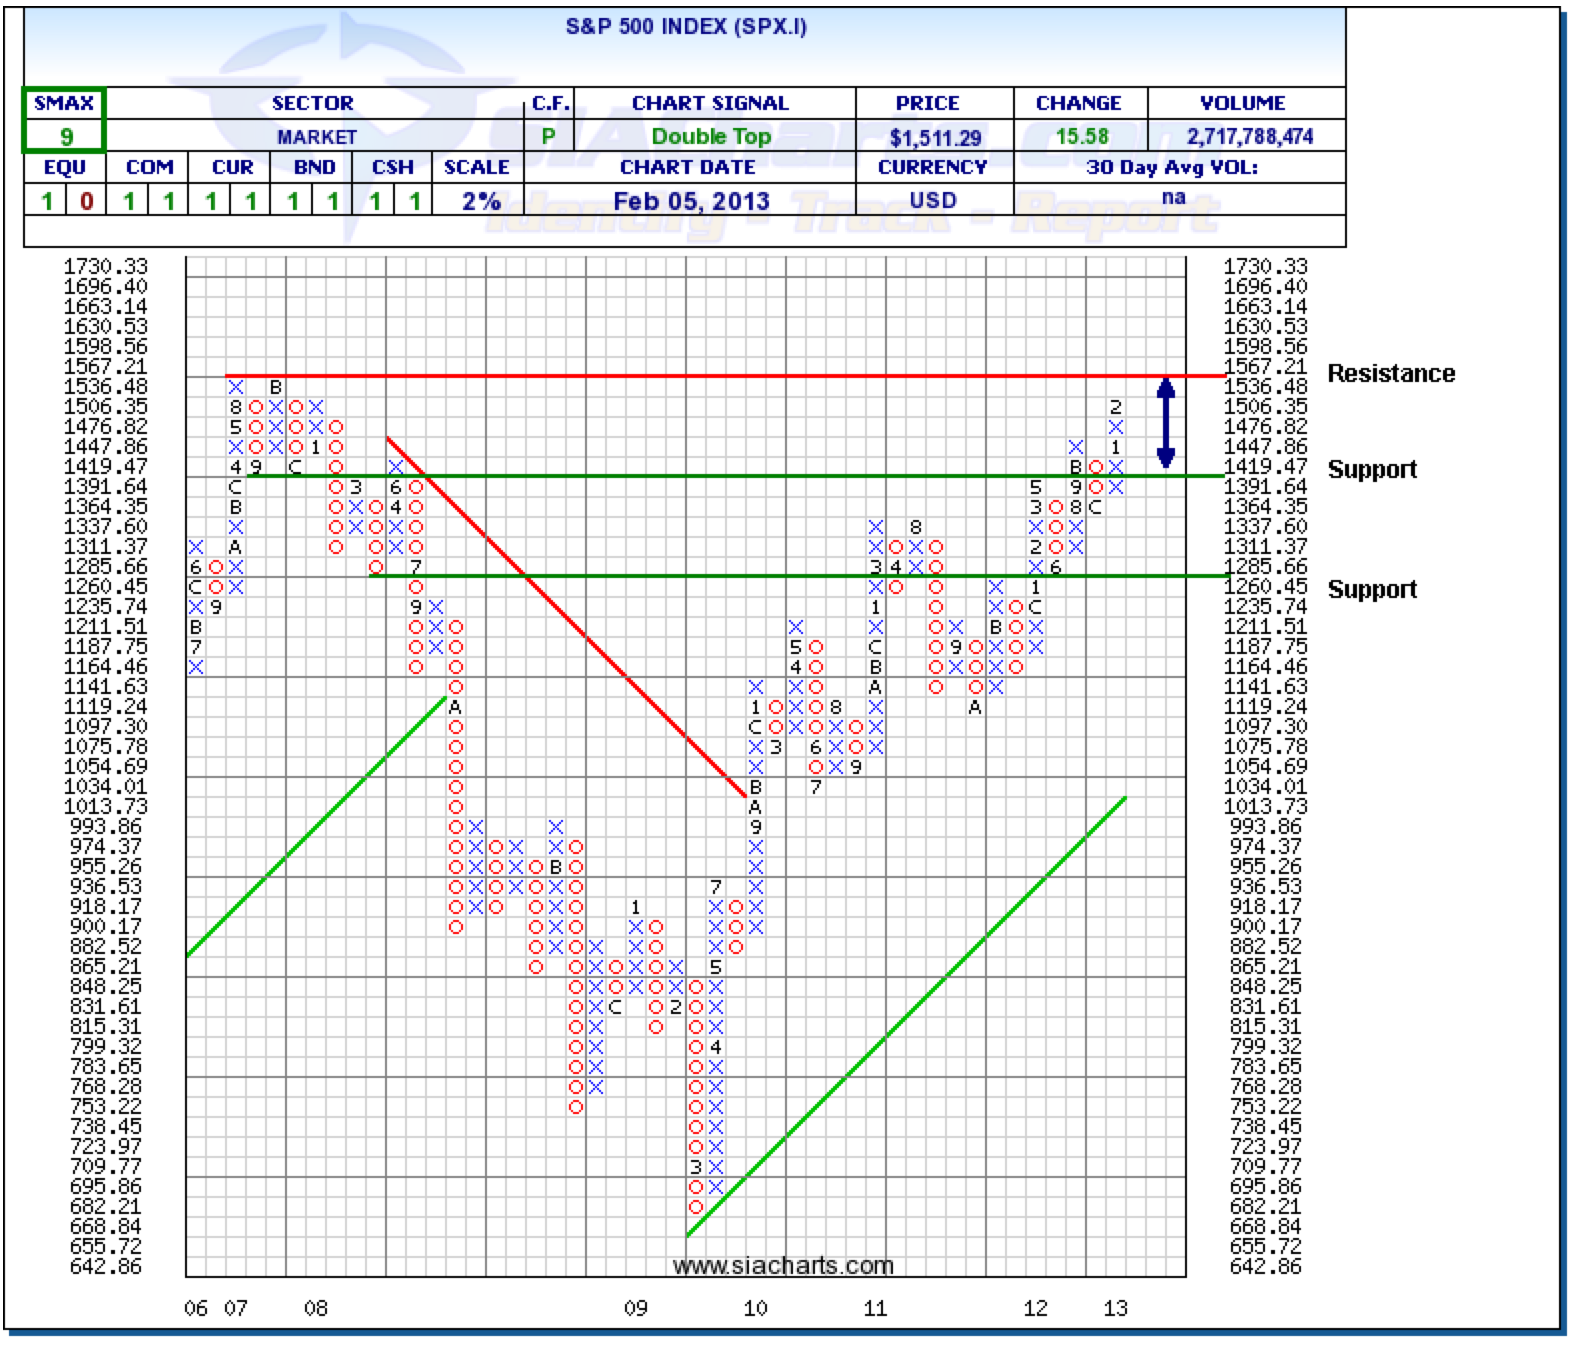
Since we last looked at SPX.I at the start of the year, the S&P 500 has moved on to multi-year highs, levels not seen since the end of 2007. The S&P 500 has moved past the prior resistance seen at 1476.82 and even above the psychological resistance at 1500. The next resistance level we are keeping a close eye on is found at 1567.21, which is the highs from 2007 and a move above this level would see new all-time highs. To the downside, support is found at 1391.64 and at 1260.45.
The other major U.S. Equity index, the Nasdaq Composite Index (not shown, but feel free to contact siateam@siacharts.com for more information) is currently up against the resistance level at 3197.67 and looking to move to new all-time highs as well.
S&P 500 Index vs. Powershares DB Commodity Index (SPX.I vs. DBC)
Click on Image to Enlarge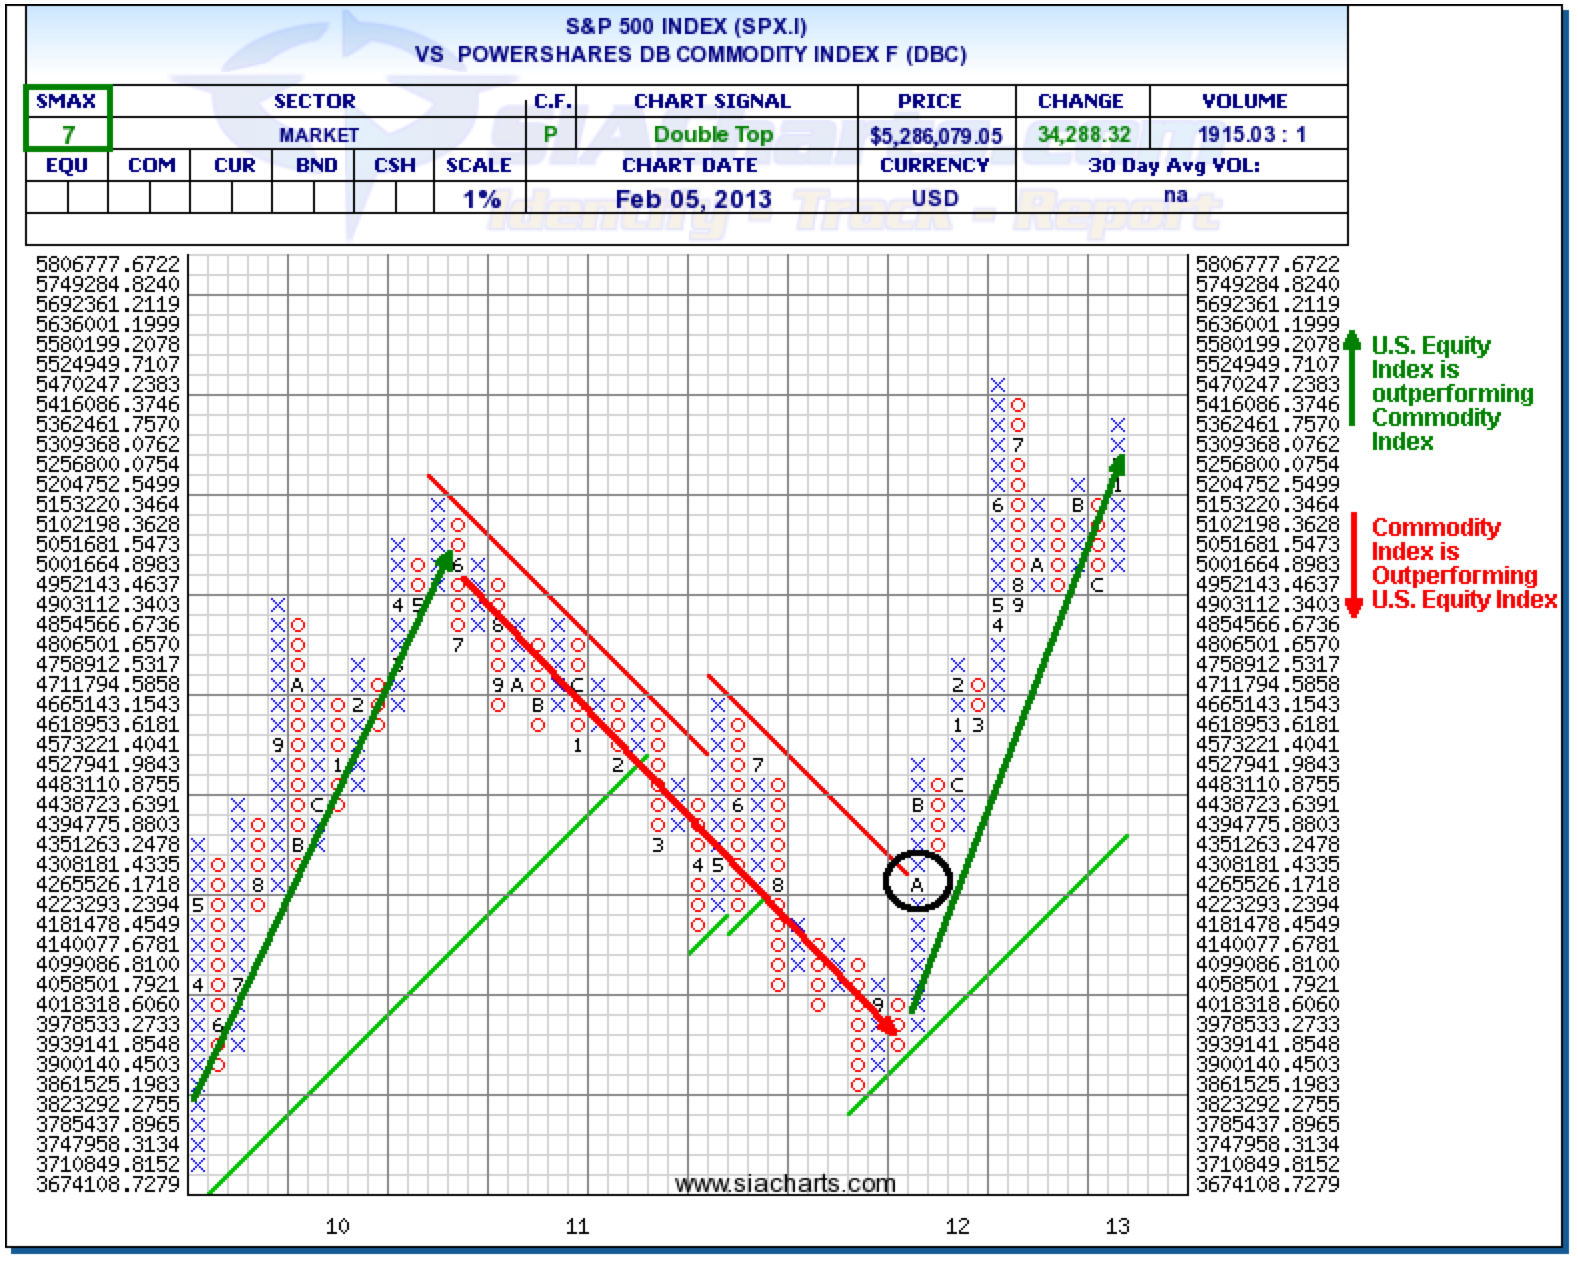
Taking a look at the comparison chart between the U.S. Equity index and a Commodity ETF index, we can see who the clear winner has been over the past year and a half: U.S. Equity. This hasn't always been the case as between June of 2010 and September of 2011, the Powershares Commodity index was outperforming U.S. Equity. But we saw a change in this relationship on Nov. 8, 2011, which is represented by the black circle in the chart, where SIA's Asset Allocation moved U.S. Equity up in its Asset rankings while keeping Commodities in the lowest spot letting our advisors know a relative strength change had occurred.
Let's look at the specifics. The SPX.I was at 1275.91 on Nov. 8, 2011 while DBC was at $28.54. Now today, using February 6, 2013 closing prices, SPX.I is at the 1512.12 level while DBC closed at $28.55. You can see over this 15 month period, the Commodity index has basically been flat, while the U.S. Equity S&P 500 index is up over 18.5%.
Going forward, the comparison chart is still showing strength towards U.S. Equity with a comparison SMAX score of 7 in favor of U.S. Equity over Commodities.