by Don Vialoux, EquityClock.com
Upcoming US Events for Today:
- Import/Export Prices for July will be released at 8:30am.
- The Treasury Budget for July will be released at 2:00pm. The market expects -$71.0B versus -$129.4B previous.
Upcoming International Events for Today:
- German CPI for July will be released at 2:00am EST. The market expects a year-over-year increase of 1.7%, consistent with the previous report.
- Canadian Net Change in Employment for July will be released at 8:30am EST. The market expects an increase of 8,000 versus an increase of 7,300 previous. The unemployment rate is expected to remain unchanged at 7.2%.
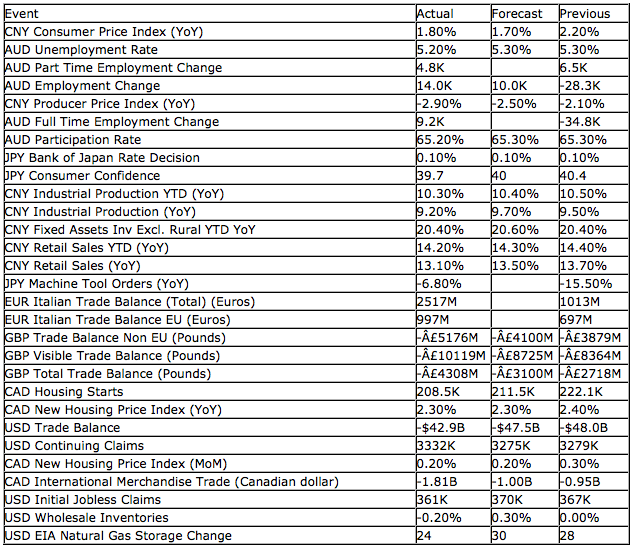
Recap of Yesterday’s Economic Events:
The Markets
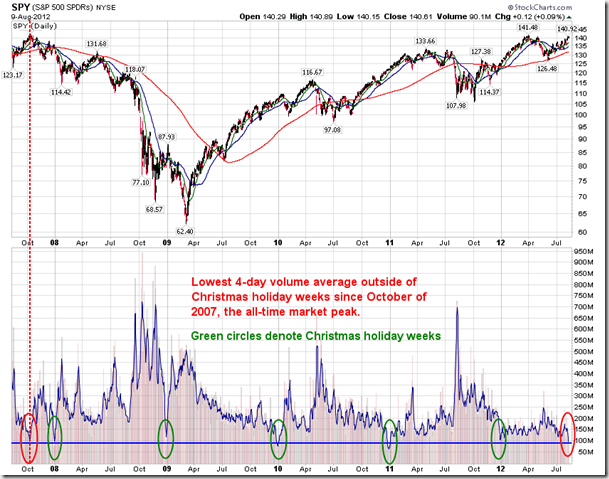
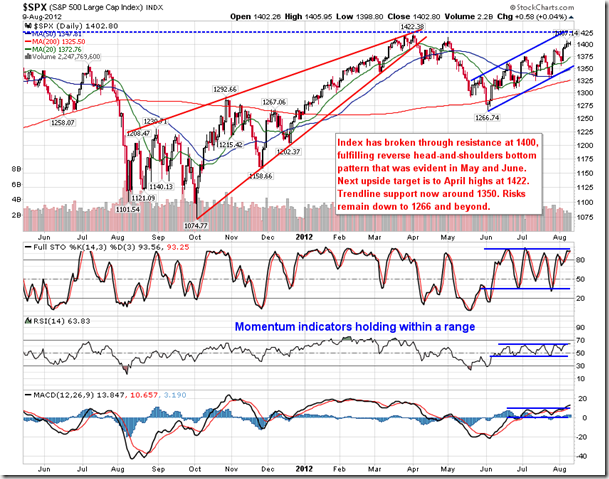
Equity markets ended flat on Thursday despite better than expected reports in the US pertaining to employment and international trade. Volume was once again deadly, amounting to the lowest four-day volume in 5 years. In an article posted by Zerohedge.com, the website notes that “the last 4 days have been the lowest volume for a non-Xmas holiday week since 2007 in futures and NYSE volumes are just remarkably bad compared to even normal cyclical seasonal dips.” Looking at the 4-day simple moving average of the S&P 500 ETF (SPY) volume, the last time the average was this low outside of a Christmas holiday week was October 2007, the last market high prior to the significant decline in the months and years to follow in 2008/2009. Volume confirms conviction, of which very little exists. Conviction to equities remains low as debate grows over the sustainability of the present rally that appears based solely on hope of further monetary stimulus from one of the major central banks around the world.
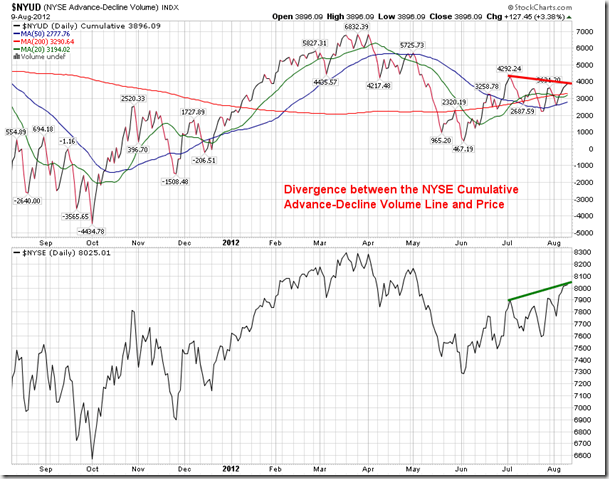
The divergence between price and volume can also be picked up on the NYSE Cumulative Advance-Decline Volume line, which is derived from the volume of advancing stocks less the volume of declining stocks. The NYSE recently managed to break firmly above the high of early July, yet the NYSE Cumulative Advance-Decline Volume Line has yet to accomplish the same. The pattern of this breadth indicator and price typically match each other, showing similar highs and lows, therefore this divergence just adds to the concern that conviction to equities is lacking, often a precursor to market declines should buyers fail to accumulate.
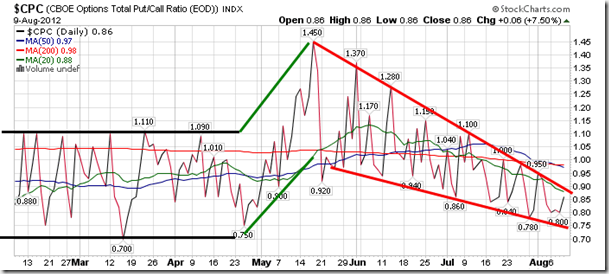
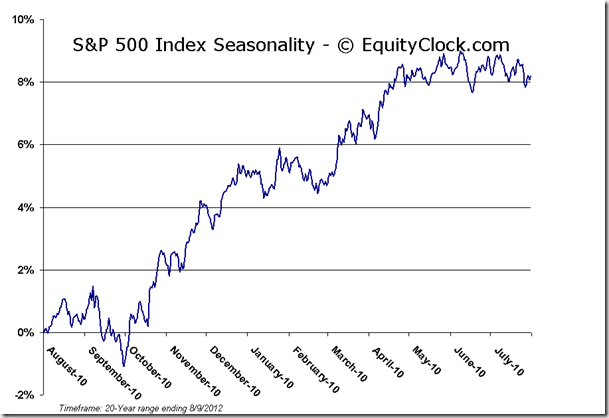
Sentiment on Thursday, according to the put-call ratio, ended bullish at 0.86. The apparent declining wedge pattern that can be derived from the ratio over the past three months is reaching a peak, which could imply a significant jump higher should the tendencies of this pattern be fulfilled. A significant move higher in the put-call ratio would likely be accompanied by an increase in volatility, a pattern that is seasonally common between now and October.
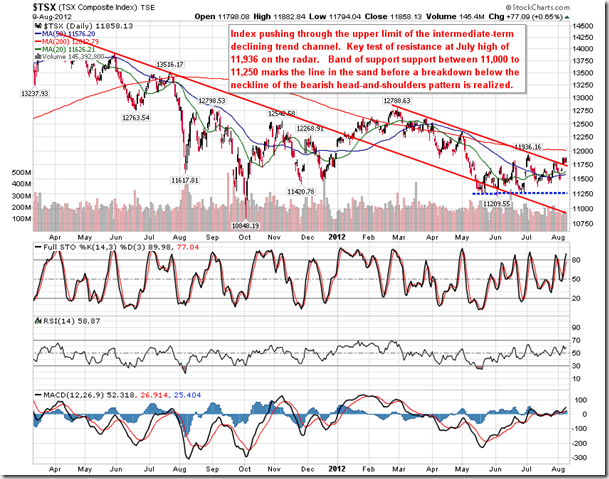
Chart Courtesy of StockCharts.com
Chart Courtesy of StockCharts.com
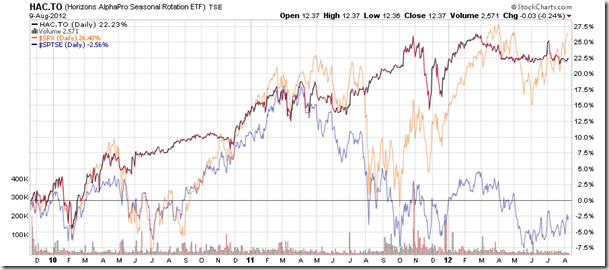
Horizons Seasonal Rotation ETF (TSX:HAC)
- Closing Market Value: $12.37 (down 0.24%)
- Closing NAV/Unit: $12.39 (up 0.18%)
Performance*
| 2012 Year-to-Date | Since Inception (Nov 19, 2009) | |
| HAC.TO | 1.72% | 23.9% |
* performance calculated on Closing NAV/Unit as provided by custodian
Click Here to learn more about the proprietary, seasonal rotation investment strategy developed by research analysts Don Vialoux, Brooke Thackray, and Jon Vialoux.
Copyright © Don Vialoux, EquityClock.com


