U.S. Blue Chips Continue to Lead
Dow Jones Industrial Average Hits "Golden-Cross"
Alfred Lee, CFA, DMS
Vice President & Investment Strategist
BMO ETFs & Global Structured Investments
BMO Asset Management
alfred.lee@bmo.com
January 5, 2012
Recent Developments:
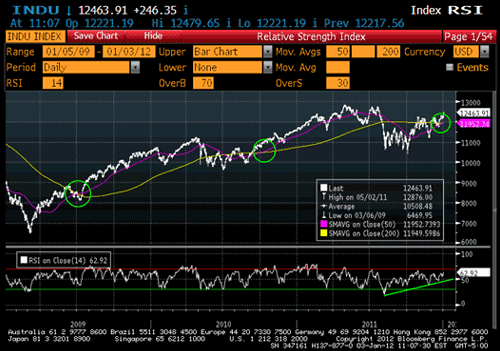
- Last Tuesday, the Dow Jones Industrial Average (Dow), hit a "golden-cross" pattern, where its 50-day moving average (MA) crossed above its 200-day MA. This tends to be a bullish indicator since its short-term average is increasing faster than its longer-term average, suggesting momentum is trending higher. As this tends to be a widely followed technical signal, it does have a tendency to create some tailwinds as it is often met with additional buying (Chart A).
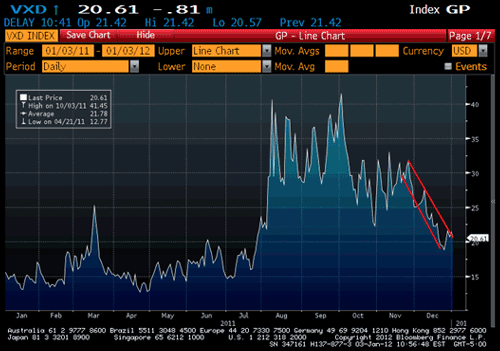
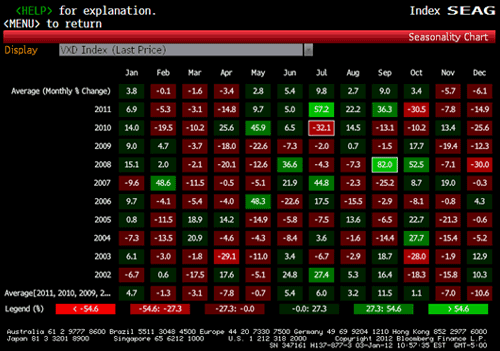
- While the recent golden-cross in the Dow can be seen as bullish, there are a number of global macro-economic risk items that remain. As a result, equity market volatility may again remain elevated for much of 2012. Although the CBOE Dow Jones Volatility Implied Index (VXD) which is also known as the "Dow VIX" trended significantly lower in the month of December, equity volatility tends to exhibit strong seasonality patterns, with VXD falling 7 of the last 10 Decembers and declining 10.6% on average in those 10 Decembers (Chart C). Currently, the futures term structure for the implied volatility index on the more broad based CBOE S&P 500 Implied Volatility Index (VIX), is positively sloped where its further dated futures contracts are higher than the near dated contracts. This indicates that the market is anticipating volatility to rise in the future.
- Similar to the beginning of 2011, we remain bullish on U.S. equities, particularly the Dow since many of the constituents are blue-chip companies with multi-national reach. Our thesis from last year remains unchanged. Many of these companies have strong cash balances, enabling them to raise dividends and/or buy-back shares while remaining well-capitalized should markets decline. From a fundamental perspective, the Dow remains attractive, trading at a current price-to-earnings (P/E) ratio of 12.9x. Last year, with the majority of equity markets facing significant headwinds, many of the Dow companies such as McDonalds Corp. and International Business Machines Corp. (IBM), made multiyear, if not all-time highs, which should be seen as a positive. In addition, from a technical perspective, the Dow displays excellent breadth with 22 of its 30 constituent companies trading above their 200-day MA. This is constructive as it suggests the majority of its constituents are driving the index higher, rather than just a few strong performing companies.
Potential Investment Opportunity:
- Canadian investors seeking exposure to the Dow without having to worry about currency volatility may want to consider the BMO Dow Jones Industrial Average Hedged to CAD Index ETF (ZDJ). Through ZDJ, investors can access the 30 blue-chip stocks in the Dow on a cost efficient basis. Alternatively, investors that are bullish on the Dow but believe the index will be slow and steady or range bound, may want to consider the BMO Covered Call Dow Jones Industrial Average Hedged to CAD ETF (ZWA). A covered call strategy allows investors to enhance yield while potentially mitigating some volatility but will underperform a non-covered strategy in a rapidly ascending market. For further information on the mechanics behind a covered call strategy, please click “Covered call Option Strategy” in the “Related Links/Downloads” section in the following link.
Chart A: The Dow Hits a "Golden-Cross"

Source: BMO Asset Management Inc., Bloomberg
Chart B: Implied Volatility on the Dow (VXD) Fell Significantly in December

Source: BMO Asset Management Inc., Bloomberg,
Chart C: Implied Volatility Tends to Fall in December Exhibiting Strong Seasonality

Source: BMO Asset Management Inc., Bloomberg
*All prices as of market close January 3, 2011 unless otherwise indicated.
Disclaimer:
Information, opinions and statistical data contained in this report were obtained or derived from sources deemed to be reliable, but BMO Asset Management Inc. does not represent that any such information, opinion or statistical data is accurate or complete and they should not be relied upon as such. Particular investments and/or trading strategies should be evaluated relative to each individual’s circumstances. Individuals should seek the advice of professionals, as appropriate, regarding any particular investment.
BMO ETFs are managed and administered by BMO Asset Management Inc, an investment fund manager and portfolio manager and separate legal entity from the Bank of Montreal. Commissions, management fees and expenses all may be associated with investments in exchange-traded funds. Please read the prospectus before investing. The funds are not guaranteed, their value changes frequently and past performance may not be repeated.
The Dow Jones Industrial AverageSM is a product of Dow Jones Indexes, a licensed trade-mark of CME Group Index Services LLC (“CME”), and has been licensed for use. “Dow Jones®”, “Dow Jones Industrial AverageSM”, “Dow Jones Canada Titan 60” “Diamond” and “Titans” are service marks of Dow Jones Trademark Holdings, LLC (“Dow Jones”)and have been licensed for use for certain purposes. BMO ETFs based on Dow Jones indexes are not sponsored, endorsed, sold or promoted by Dow Jones, CME or their respective affiliates and none of them makes any representation regarding the advisability of investing in such product(s).


