by John West, Research Affiliates LLC
The asset management business involves its fair share of travel. Mechanical delays, cancelled flights, inclement weather, hotel overbookings, and traffic snarls are just a few of the many things that can get in the way of getting to a meeting on time. But every once in a while, we get luckyâsecurity is a breeze, the flight arrives 20 minutes early, thereâs no line at the cab stand, traffic is nonexistent, and the hotel gives us a free upgrade. These rare instances are a blessed welcome.
Of course, it is not prudent to rely on good fortune, planning our itinerary on the basis of everything going right. Suppose weâre planning a very important tripâone that will determine the financial well being of our company and our employees, not just for the next few years but the decades ahead. Most of us would be ultra-conservative in building our itineraries, with contingency plans for anything that might go wrong. Weâd arrive not just the night before, but the morning before. Weâd FedEx our materials and bring some hard copies with us (not even relying on our computers). We would map out the route, research the traffic, and leave an ample cushion of time for all the potential pitfalls of the journey.
Unfortunately, the return assumptions built into pension and retirement plans today are analogous to our traveler assuming that everything will go right. Hope is now the bedrock of financial planning, discount rates and pension return assumptions, allowing for no disappointments along the way. In this issue we attempt to quantify the hoped-for good luck that is needed for todayâs retirement assets to fully cover tomorrowâs retirement liabilities. We discover $16 trillion in assets are, in effect, counting on the plane getting to the gate an hour early, followed by a road-clearing motorcade.
(click to enlarge)
Baseline Expectations
We canât predict the future with complete accuracy. As physicist Niels Bohr once quipped, âPrediction is very difficult, especially if itâs about the future.â But we can build reasonable starting points by looking at the key components of long-term asset class returns. As we outlined in February, the return for almost any asset class can be broken down into
income, growth (real growth plus expected inflation), plus changing valuation multiples.2 These are the âbuilding blocksâ of return. Using this simple method and todayâs yields, we get the long-term expectations (10â20 years) for stocks and bonds shown in Table 1.
Most pension funds and 401(k) calculators assume total returns in the 7â8% range, and sometimes a bit higher. And yet, stocks and bondsâthe two pillars for most investor portfoliosâare expected to return 5.2% and 2.5%, respectively. Indeed, the return on the classic 60/40 blend of the two is not even 4.5%. With an approximate 3% differential, we have a stark disconnect
between these simple âbuilding blockâ estimates and ârequiredâ return rates.3 Are the return estimates wrong? Itâs a legitimate question: these return estimates shouldnât be taken as
fact. One client remarked to me many years ago that we know our forecasts are going to be wrong; we just donât know by how much they are going to be wrong. Can the markets do better than these anemic prospects? Of course! Conversely, can they do worse? Absolutely!
Polly Annaâs Projections
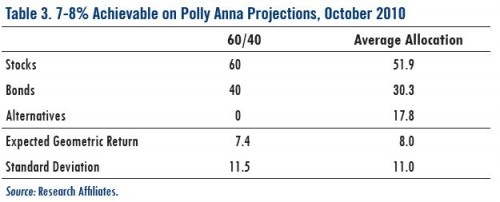
Polly Anna, head of the pension plan for Global Giant Corp., uses âtypicalâ U.S. pension fund assumptions for her required return and asset allocation assumptions. Thus, she uses an 8% required return and the average U.S. pension fund asset allocation, currently 51.9% stocks, 30.3% bonds, and 17.8% in everything else (âalternativesâ).4 Because the alternatives are used to seek equity-like returns while diversifying away some of the risk, most of her peers use return assumptions for alternatives that are similar to those of stocks. Using the estimates in Table 1, Polly Annaâs 52/30/18 asset mix has a forward-looking return of only 4.7%. Viewing a 4.7% return as unacceptable relative to her 8% required return, Polly looks to the return forecast for three principal asset classes to see if she can squeeze more return from her investments.
- StocksâThe first three components are pretty straightforward. The yield is what it is. Not much wiggle room there. The real growth in earnings and dividends has been just under 1% over the past 100 years, though it reached 2% during the second half of the 20th century. Dare we expect more, with a mature economy saddled with unprecedented debt and an aging workforce?5 Maybe inflation resumes, boosting our notional earnings and dividend growth. Thatâs a dangerous choice because valuation multiples usually falter in the face of inflation uncertainties. So, thereâs precious little opportunity to boost our expectations on these three building blocks.
The only remaining assumption is âchanges in valuation.â Changes in the value that the market is willing to pay for a dollar of earnings and dividends can have a huge impact on even long-term returns for equity investors.6 The market paid twice as much for each dollar of earnings or dividends just 10 years ago. Maybe we can return to those valuation levels? Todayâs 10-year cyclically adjusted P/E ratio (so called Shiller P/E) is 20. Polly calculated what stocks had done on a subsequent 10-year basis from similar P/E levels,7 and then took the 75th percentile observation, indicating a top quartile outcome from todayâs level, as her optimistic projection. This works out to 9.5%, a nearly 4% percentage point premium above our baseline.8
What a relief! Top quartile stock returns from todayâs valuation level can get the returns we need.
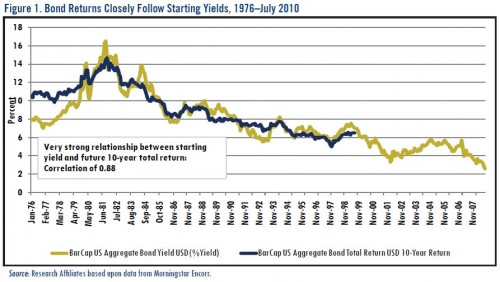
- BondsâThe starting yield on a core bond portfolio such as the BarCap Aggregate Index is a very accurate predictor of the likely return of the next 10 years, as Figure 1 shows. Even with
big changes in yields over the subsequent 10 years, the return doesnât change much from the
starting yield. Why? Rising yields mean falling prices; these all-too-often cancel each other out in bond-land. But there can be modest differences. Polly Anna took all of the differences between the starting yield and the subsequent 10 years of performance and identified the 75th percentile premium of 0.86%. She then added this to the current yield, for a forward projection of 3.35% for core bonds.
- AlternativesâMany investors, keenly aware that returns will be lower than the past 30 years, have turned to alternative categories like hedge funds, private equity, infrastructure, emerging markets, timberland, and so forth, in a quest for equity-like returns and diversification of risk. This eclectic group has a relatively short history, dubious data (i.e. survivorship bias), and a heavy reliance on the most difficult metric of all to forecastâ manager alpha. Thus, Polly simply took the 75th percentile 10-year return for the HFRI Hedge Fund of Fund Composite, which equated to 9.4%.9 Even with the boost from survivorship bias, this gets us no better than the top-quartile stock market return. Still, her 8% return assumption does seem within reach. Finally, Polly likes to assume that her results will capture an âalpha.â Of course, asset managers donât all grow up in Lake Wobegon; theyâre not all above average. Alpha is a zero sum game; if weâre winning, someone else is losing. Fortunately, Polly doesnât have to make this added leap. Top quartile outcomes for each of the three asset classes gets us to 8.0%.
As Table 3 shows, with the revised assumptions shown in Table 2, sheâs got what she needs. Or does she? Table 3 illustrates that Polly can âget thereâ only by assuming top quartile results for stocks, bonds, and alternatives. Furthermore, all three must produce these lofty results simultaneously over the same span! What are the odds of that? Assuming these projections are representative, this works out to 25% Ăâ 25% Ăâ 25%, or about a 1.6% chance. Yikes! This is exactly what the overwhelming majority of the U.S. retirement marketâpension funds, state budgets, IRAs, 401(k)s, etc.âis not only hoping for but depending upon. Thatâs $16 trillion of assets expecting a decade of sunshine to achieve the 7â8% targeted returns used for planning and budgeting purposes.
(click to enlarge)
Targeted ReturnsâExpectations or Aspirations?
There is nothing inherently wrong with aspiring to a certain rate of return, the same way there is nothing wrong with anticipating an early flight. The disconnect occurs when we rely upon high returns or an early flight. Weâre staking huge financial resources on a high return assumption, despite overwhelming evidence to the contrary. The only way todayâs expected returns can match tomorrowâs targeted returns is through remarkable good fortune in the years ahead. Weâre relying on hope. But hope is not a strategy; hope will not fund secure retirements. Weâre planning for the best and denying that worse can happen. It makes far more sense to hope for the best, with plans for realistic outcomesâand contingency plans for worse
ones.
While we think it folly to depend upon lofty targeted returns, we can still aspire to earn more. Next month, weâll do exactly that, as we share a sensible roadmap to
attaining higher returns.
Endnotes
1. In the 1990s, there was a book on marketing by this title. The title can apply, just as aptly, to much of the financial services industry.
2. See âLessons from the âNaughties,ââ Fundamentals, February 2010, http://researchaffiliates.com/ideas/pdf/Fundamentals_201002.pdf.
3. In a 2005 âEditorâs Corner,â Rob Arnott suggested that pensions should compute their liabilities using the Treasury yield curve because the liabilities could be fully immunized at this rate. This idea wasâneedless to sayânot eagerly embraced, though a few funds now do this informally so that they can be aware of their downside. See âThe Pension Problem: On Demographic Time Bombs and Odious Debt,â Financial Analysts Journal, November/December 2005.
4. See âData & Directories,â Pensions & Investments, December 28, 2009. http://www.pionline.com/article/20091228/CHART2/912239982/1044/DataBook.
5. See âThe 3D Hurricane: Deficit, Debt and Demographics,â Fundamentals, November 2009, http://researchaffiliates.com/ideas/pdf/Fundamentals_200911.pdf.
6. As an example, P/E expansion and contraction has contributed on a per annum basis between â7% and +9% to S&P 500 Index returns over the past five decades.
7. 18â22 P/E.
8. Incidentally, the only time periods that witnessed double digit stock returns for 10 years where starting valuations were in todayâs range was from 1992â1995 to 2002â2005 where the P/E ratio ended about 25% higher in the 25 range. This positive outlier will skew stock market returns for the years to come!
9. We used the Fund of Funds Composite (which only dates back to 1990) as it is less likely to be affected by survivorship bias. But even this is highly optimistic. The best 10-year returns were generated when the âindustryâ was operating on a much smaller asset base than the current $1.7 trillion. https://www.hedgefundresearch.com/pdf/pr_20100720.pdf.
Copyright (c) Research Affiliates LLC


