


Via Lance Roberts of Street Talk Live,
There have been several articles as of late discussing that the next great secular bull market has arrived. Historically, secular bear markets have averaged about 14 years, and considering that we began writing about the current secular bear market cycle in early 2000, that would put the current cycle about 2 years away from it historic average. However, the reality is that this cycle is currently unlike anything that we have potentially witnessed in the past. With massive central bank interventions, artificially suppressed interest rates, sub-par economic growth, high unemployment and elevated stock market prices it is likely that the current secular bear market may be longer than the historical average. In either event we are likely closer to the end than the beginning and the next major stock market correction will likely be the last for this cycle.
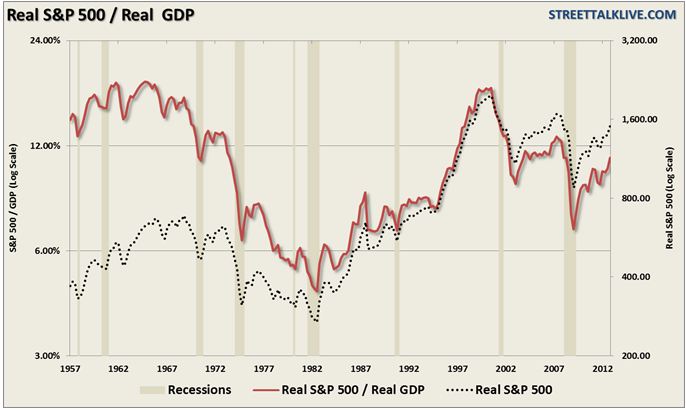
There are several fundamental reasons from valuations to the current level of interest rates that support this viewpoint. The first chart shows the inflation adjusted, or “real”, ratio of the stock market to the economy as measured by GDP. With the economic recovery, such as it is, currently in its fourth year, the market to GDP ratio is beginning to push levels that are normally consistent with cyclical bull market peaks rather than where secular bear markets have ended.
Furthermore, secular bull markets do not begin when prices are already stretched well above their long term growth trend. I often use the “rubber ball” analogy to express the movement of prices relative to their trends. Like throwing a rubber ball into the air – the momentum of the throw can make it seem like it is temporarily defying the laws of gravity. However, the effect of momentum will fade as the pull from gravity increases on the ball until it reaches its maximum height. The ball will then quickly revert back to earth. The same goes for the financial markets.
The chart below shows, very importantly, that secular BULL markets do not begin when prices are already trading well above their long term growth trend. Very much like past secular bear markets – prices can remain above their long term growth trend for quite some time until they eventually “mean revert.”
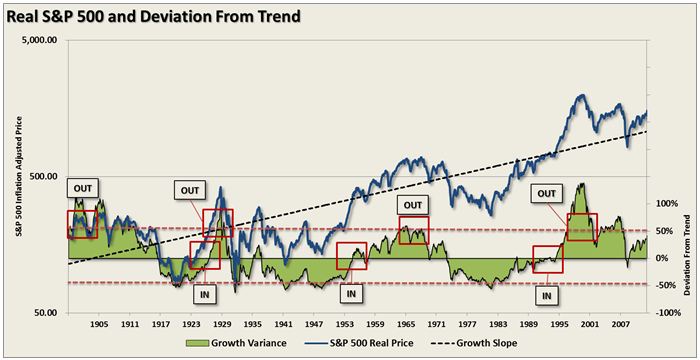
These reversions take prices to a position that is an equal distance below the long term growth trend. As the chart shows – if you had moved out of the market in early 2000 and gone into bonds you will still be well ahead of those that had stayed in the stock market.
Not surprisingly, when prices are elevated well beyond their long term trends, valuations are at levels that are normally associated with secular bull market peaks rather than the troughs where secular bull markets are usually born.
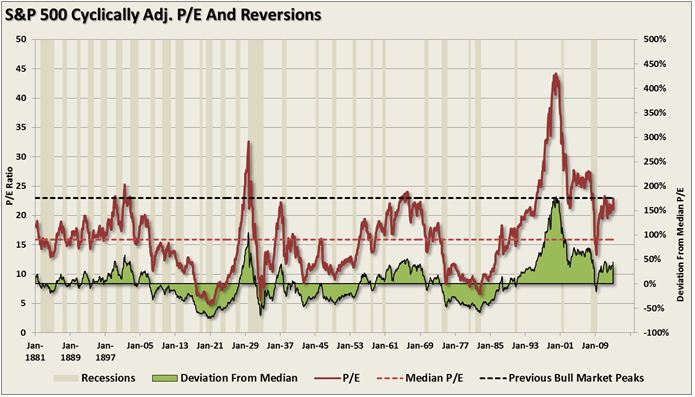
The chart below uses the Shiller Cyclically Adjusted P/E (price to earnings) ratio which has been inflation adjusted. The immediate argument to this analysis is that some analyst on television stated the “valuations are cheap based on ‘forward earnings expectations’ which are below the long term average.” There are two huge flaws in that statement:
1) The long term median P/E as shown below is based on TRAILING REPORTED earnings. Not forward operating earnings which are full of accounting issues. This is an “apples to oranges” comparison.
2) More importantly, forward earnings are ALWAYS overly optimistic by as much as 33% historically. Therefore, the valuation argument is generally wrong at the outset.
This brings us to the “stocks are cheap based on interest rates” argument. Despite the fact that prices and valuations are stretched well above their historic norms this does not deter the media from finding some other flawed argument to try and lure “suckers”… um…I mean…investors into the Wall Street casino.
The chart below is the “Fed Model” which is the basis for the “stocks are cheap because earnings yield is higher than bond yields.”
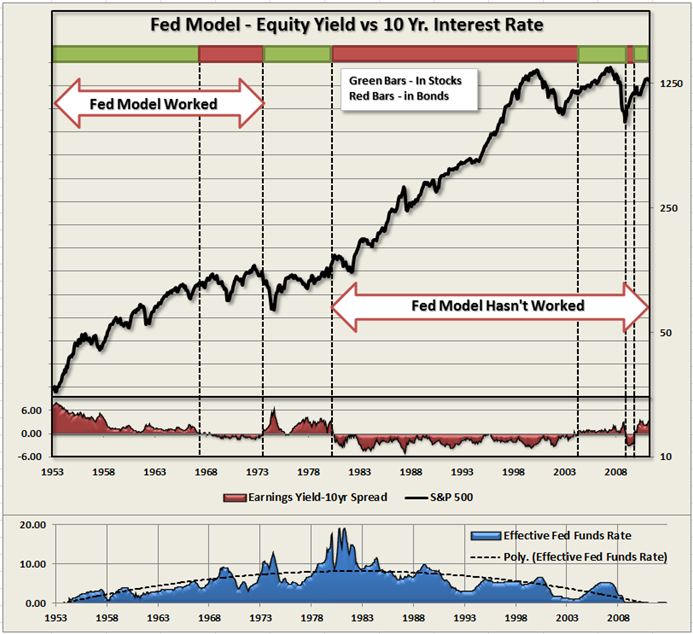
Following this model would have kept you out of stocks primarily when you should have been in and vice versa. This is due to the intervention by the Fed to suppress interest rates to support economic growth. These suppressions have driven interest rates consistently lower over time and have been the primary factor in the creation of one bubble after the next. Subsequently, when the Fed raises interest rates, it causes a dislocation in the markets.
The fallacy of the model is quite simple. THERE IS NO SUCH THING AS EARNINGS YIELD. The earnings yield is simply the inverse of the P/E ratio whereby corporate earnings are divided by the price of the market. However, as an investor in a stock you do not receive the earnings yield in the form of a cash payment. However, YOU DO receive the interest yield from bonds.
This is a very, very flawed analysis and one that should be forever stricken from your investment valuation models.
Nothing Organic About It
No matter how you slice the data - the simple fact is that we are still years away from the end of the current secular bear market. The mistake that analysts, economists and the media continue to make is that the current ebbs and flows of the economy are part of a natural, and organic, economic cycle. If this was the case then there would be no need for continued injections of liquidity into the system in an ongoing attempt to artificially suppress interest rates, boost housing or inflate asset markets.


