by Jurrien Timmer, Director of Global Macro for Fidelity Management & Research Company
Watching for signs of a new bull market.
Key takeaways
- While the market as a whole has made gains this year, a small number of mega-cap stocks have been the main drivers of those gains.
- That looks inconsistent with the idea that we're in a new bull market, since early bulls tend to be characterized by broad-based gains and rising small caps (which we haven't seen).
- That said, earnings have continued to prove surprisingly resilient.
- With each decent earnings season we see, it becomes less likely that the market takes another leg down (and more likely that we're already in the start of a bull market).
My, how the time flies. It's now almost June and it has been about a year since the market started going nowhere. So, let's take stock of where we are in this unusual market cycle, and what we might expect for the rest of the year and beyond.
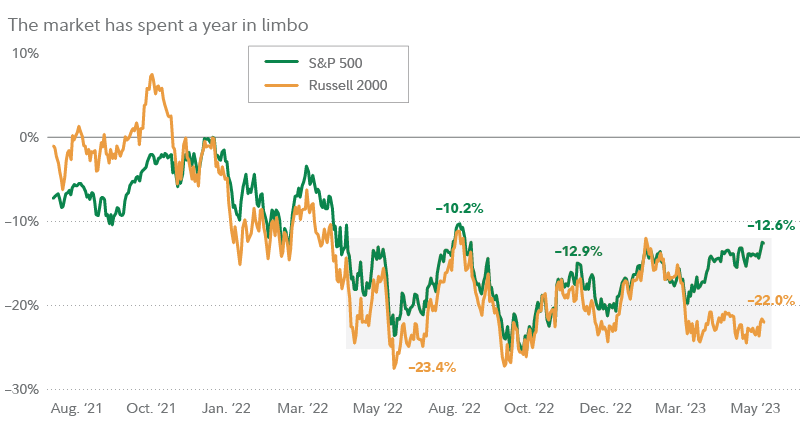
A market in limbo
The stock market has been essentially directionless since June of last year. That's a long time to be in limbo, and it makes me wonder whether the strength in the S&P 500® in recent weeks could indicate that the next (or current) bull market is finally declaring itself.
 Past performance is no guarantee of future results. Returns indexed to zero as of the market’s high in January 2022. See below for additional disclosures on the S&P 500 and Russell 2000. Source: FactSet, FMRCo.
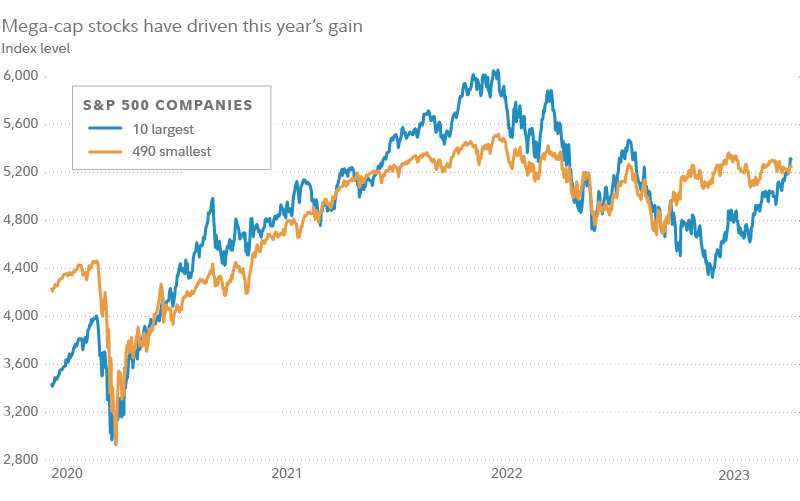
If that strength had been broad based, with many stocks making gains, it would be easy to call this a new bull market. But the opposite has been true. Because the S&P is weighted by market capitalization, the largest companies have an outsized influence on its movements. And indeed, so far this year, the gains have been driven by just a handful of mega-cap stocks, while the rest of the market has languished.
 Past performance is no guarantee of future results. Indexed value based on performance of largest 10 and smallest 490 constituents of the S&P 500, based on market capitalization. Source: FMRCo., Bloomberg.
As I've written about before, it's particularly notable that small- and micro-caps have been lagging this year. Early-cycle bull markets tend to be driven by segments and styles that are more economically sensitive and more volatile. Small- and micro-cap indexes are usually in or close to the lead in an early bull market, so their weakness this year hasn't looked consistent with a new bull market.
Could it be that a new bull market—albeit one that doesn't look like past new bull markets—is nonetheless quietly underway? Or is that big market-clearing rout that so many investors seem to be waiting for just around the corner? Let's look at both sides of the argument.
The bearish view and the bullish view
The bearish outlook is that the much-anticipated recession is going to finally arrive, and that we are on the brink of an earnings washout that will trigger another down leg—in what will prove to be a prolonged bear market.
The bullish outlook is that interest rates have peaked, the Fed is done, the economy is holding up, and earnings will rebound later this year.
So far, earnings have proved surprisingly resilient. Earnings estimates seem to weigh in favor of the bulls, with consensus estimates expecting that earnings growth is bottoming now, and will return to a 10% growth rate in 2024. And corporate revenues have continued to march to new all-time highs (in non-inflation-adjusted terms, at least) through this market cycle.
Historically, stocks prices tend to recover about 2 to 3 quarters before earnings do. If the bullish view is right, it would make sense for the bull market to start declaring itself now.
The Fed and the economy
What about some of the other factors at play?
First and foremost is Fed policy. Until recently, the consensus among investors was that the Fed had raised rates for the final time this cycle during its May meeting, with the market expecting that the Fed would actually soon begin cutting rates. That outlook was suddenly called into question with last week’s inflation reading—which showed the core Personal Consumption Expenditures index (a measure of inflation that excludes food and energy prices), rose more than expected in April, and at a faster year-over-year pace than it had in the previous month. Now, the market is pricing in a higher chance of one additional rate hike in July.
My guess is that the Fed may indeed be close to done (or done) raising rates for the cycle, but that it will be a while before it cuts rates, unless the economy falls off a cliff and takes inflation with it. So far, that has not happened.
Ultimately, whether the Fed is done raising rates for the cycle will come down to the usual suspects: inflation and employment. Inflation has generally been heading in the right direction—notwithstanding the most recent report—although it's clearly not yet back at the Fed's targeted level. And the employment picture continues to hang in there, with unemployment merely 3.4% as of the most-recent reading.
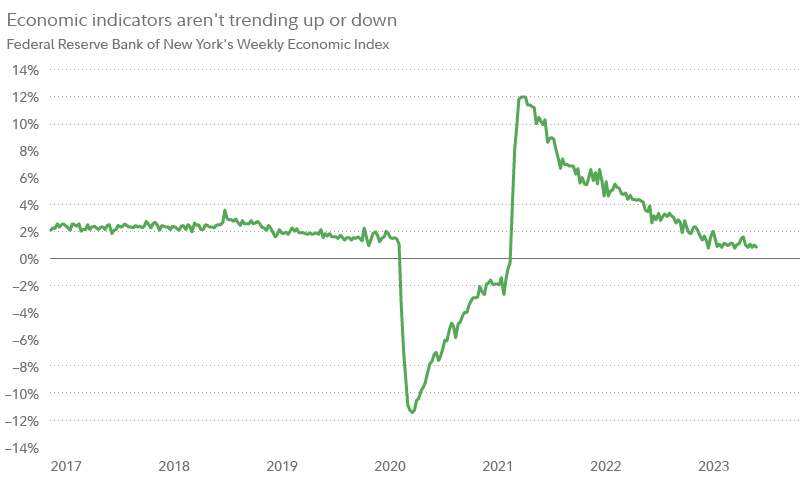
Meanwhile, the economy seems to be showing neither positive nor negative momentum. The Fed's Weekly Economic Index is a diffusion index, which means it takes a basket of economic indicators and measures how many of them are rising, versus how many of them are falling. Lately, the index has been hovering right around zero.
 Past performance is no guarantee of future results. The Weekly Economic Index (WEI) is an index of 10 daily and weekly indicators of real economic activity, scaled to align with the 4-quarter GDP growth rate. The index is not an official forecast of the Federal Reserve. Weekly data. Source: FMRCo., Bloomberg.
What about the debt ceiling?
One potential near-term speed bump may be the fiscal cliff. While news headlines suggest that a deal may be close at hand, nothing is certain until a deal is passed by both chambers of Congress and signed into law. The exact timing of the X-date (the date when the Treasury could essentially run out of cash) is hard to pin down with precision, but estimates are that it could fall as soon as June 5. At that point, the Treasury would need to start picking and choosing which bills to pay.
I believe that, sooner or later, the debt ceiling will get raised. And when it does, it will likely be welcome news for the market. But how quickly this happens, and how much volatility is created until that happens, is anyone's guess.
Watching for signs of a bull
Coming back to the near-to-intermediate-term outlook for the market—what might the next signs be if we are indeed in a new bull market?
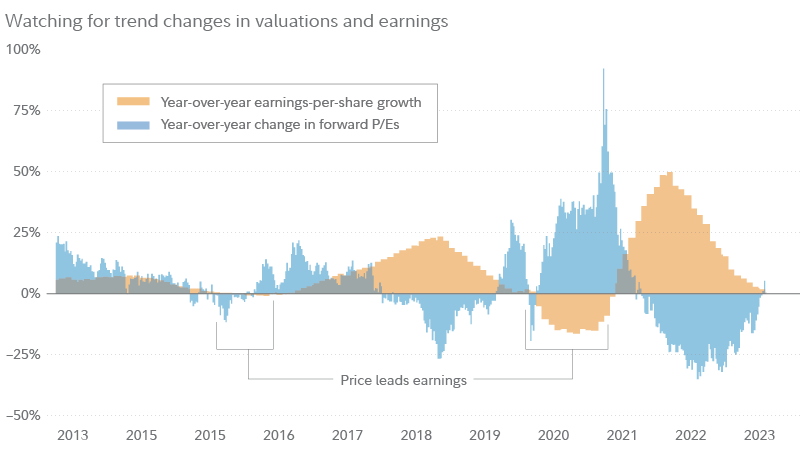
One signal I'm watching for is the relationship between earnings and valuations (such as price-earnings ratios, or P/Es). Stock prices typically recover before earnings do. This means that the early phases of bull markets have historically been driven by rising P/Es—because prices are rising even as earnings are still falling.
Looking at the chart below, a classic bullish playbook would be to see the rate of change in P/Es, in blue, cross up to the positive side, even as earnings growth, in orange, continues to weaken (but not by too much).
 Based on data for S&P 500 constituent companies. Forward P/E is stock price divided by consensus earnings estimates for the following 12 months. Weekly data. Source: FMRCo., Bloomberg.
As I said, the overall resilience in earnings has been surprising, given that the Fed has raised rates by 5 percentage points in little more than a year. One theory that might explain it is that the economy has become less sensitive to rate increases. After all, homeowners and corporations had ample opportunity to refinance their debt during the ultra-low interest rate days of 2020 and 2021.
And to be sure, a big hit to earnings could still be coming. But with every decent earnings season that comes and goes, time seems to be running out for the doomsday scenario.
Now, if only small caps would play along.


