
The Bottom Line
Lots of cross currents are expected to impact equity markets between now and the end of the year!
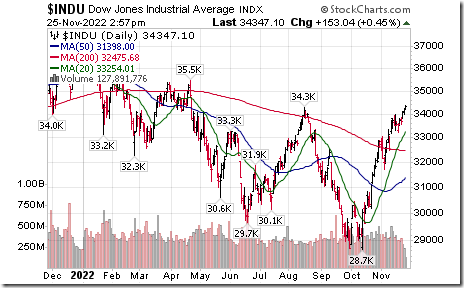
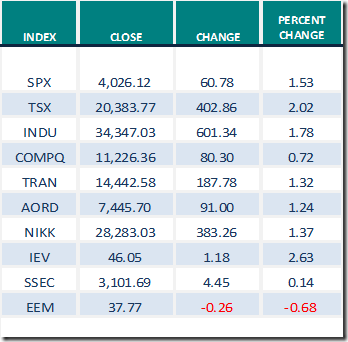
- Technical action by broadly based North American equity indices is encouraging. The Dow Jones Industrial Average broke above its August high at 34,281.36 on Friday to a six month high. The TSX Composite Index broke above its August high at 20,323.57 on Thursday to a six month high.

- Seasonal influences for developed world equity markets are positive until the first week in January. They are strongest in the last week in November and in the December 16/January 6th period.
- Earnings estimates for major North American companies continue to drift lower. S&P 500 earnings in the fourth quarter are expected to drop 2.1% on a year-over-year basis.
- U.S. economic focus is on efforts by the Federal Reserve to lower inflation rate by raising the Fed Fund rate. Consensus currently calls for another 50 basis point increase in the Fed Fund Rate to 4.25%-4.50% on December 14th. Next significant data point watched by the Federal Reserve prior to the December 13th meeting occurs this Thursday when the October Core PCE Price Index is released.
- A national strike in the U.S. railway industry starting the end of next week is possible. Without a settlement, the unions are set to go on strike at 12:01 am ET on December 9. Producers of time sensitive materials (e.g. chemicals) already are postponing shipments.
- ‘Tis the season for tax loss selling prior to yearend! Tax loss selling pressures are expected to be higher than average this year because North American equity prices on average are significantly lower than last year. Investors will want to realize losses for tax purposes before the end of the year to offset capital gains realized in previous years.
Economic News This Week
September Canadian real GDP released at 8:30 AM EST on Tuesday is expected to increase 0.1% versus a gain of 0.1% in August. Third quarter Canadian GDP is expected to increase at an annualized rate of 1.5% versus a gain of 3.3% in the second quarter.
U.S. third quarter U.S. GDP released at 8:30 AM EST on Wednesday is expected to increase at an annualized rate of 2.7% versus a gain of 2.6% in the second quarter.
November Chicago PMI released at 9:45 AM EST on Wednesday is expected to improve to 47.1 from 45.2 in October.
Beige Book is released at 2:00 PM EST on Wednesday.
October Core PCE Price Index released at 8:30 AM EST on Thursday is expected to increase 0.3% versus an increase of 0.5% in September. On a year-over-year basis October Core PCE Price Index is expected to increase 5.0% versus a gain of 5.1% in September.
October Personal Income released at 8:30 AM EST on Thursday is expected to increase 0.4% versus a gain of 0.4% in September. October Personal Spending is expected to increase 0.8% versus a gain of 0.6% in September.
October U.S. Construction Spending released at 10:00 AM EST on Thursday is expected to drop 0.3% versus a gain of 0.2% in September.
November ISM Manufacturing Purchasing Managers Index released at 10:00 AM EST on Thursday is expected to slip to 49.8 from 50.2 in October.
November Non-farm Payrolls released at 8:30 AM EST on Friday are expected to increase 200,000 versus a gain of 261,000 in October. November Unemployment Rate is expected to remain unchanged at 3.7% in October. November Average Hourly Earnings are expected to increase 0.3% versus a gain of 0.4% in October. On a year-over-year basis, November Average Hourly Earnings are expected to increase 4.6% versus a gain of 4.7% in October
November Canadian Employment reported at 8:30 AM EST on Friday is expected to drop 10,000 versus a gain of 108,300 in October. November Unemployment Rate is expected to increase to 5.3% from 5.2% in October.
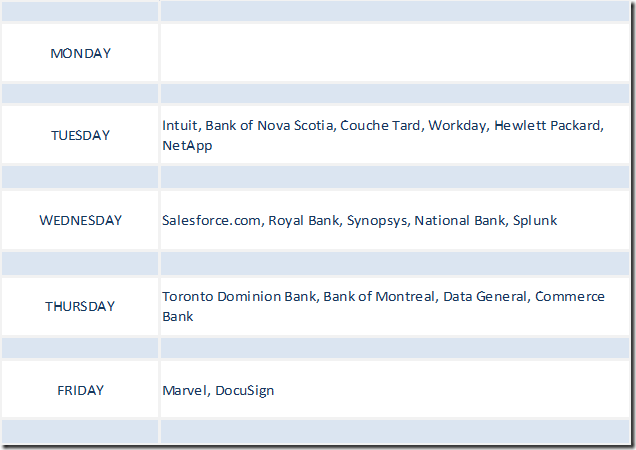
Selected Earnings News This Week
Focuses this week are on reports by Canada’s major banks
Trader’s Corner
Equity Indices and Related ETFs
Daily Seasonal/Technical Equity Trends for November 25th 2022
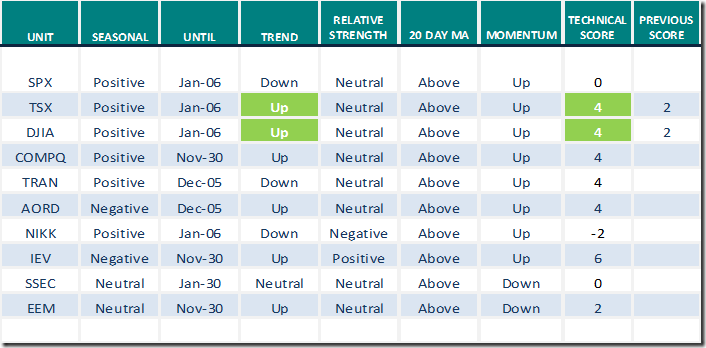
Green: Increase from previous day
Red: Decrease from previous day
Commodities
Daily Seasonal/Technical Commodities Trends for November 25th 2022
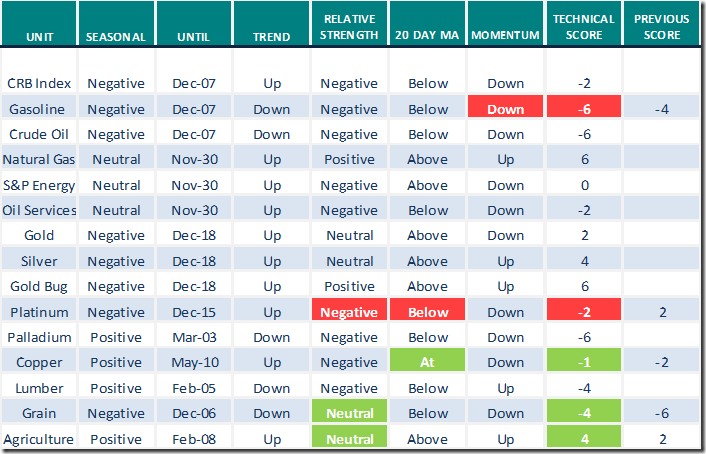
Green: Increase from previous day
Red: Decrease from previous day
Sectors
Daily Seasonal/Technical Sector Trends for November 25th 2021
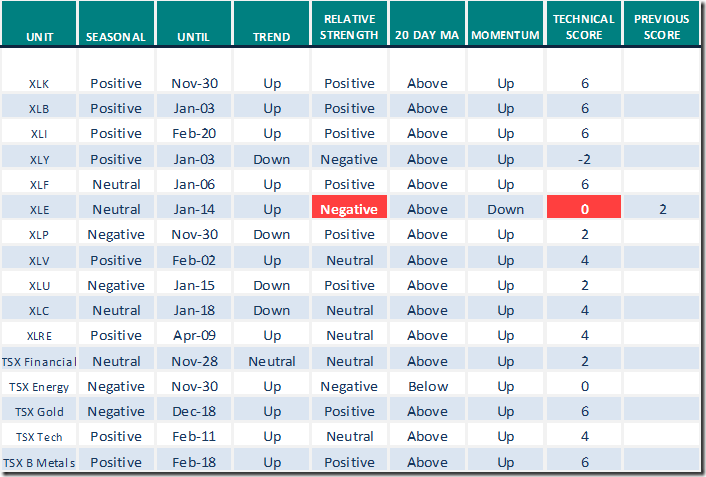
Green: Increase from previous day
Red: Decrease from previous day
Links offered by valued providers
Greg Schnell says “Some bull market sectors are forming”.
Some Bull Market Sectors Are Forming | The Canadian Technician | StockCharts.com
Michael Campbell’s Money Talks for November 26th 2022
Michael Campbell’s MoneyTalks – Complete Show (mikesmoneytalks.ca)
Greg Schnell discusses “The art of selling your stocks” (Archived video)
https://www.youtube.com/watch?v=bsJHiLLH82I
Carl Swenlin notes “Industrial sector gets golden cross Buy signal”
Industrials Sector Gets Golden Cross BUY Signal | DecisionPoint | StockCharts.com
Josef Schachter discusses “China slowdown and crude oil”
China Slowdown and Crude Oil – HoweStreet
Mark Leibovit discusses “Stock market rise versus crypto collapse
Stock Market Rise vs. Crypto Collapse – HoweStreet
Victor Adair’s Trading Notes for November 26th
Trading Desk Notes For November 26, 2022 – HoweStreet
Tom Bowley discusses ”The three key ingredients of stock portfolio construction” Includes a valuable discussion on the use of seasonality in your portfolio.
Link by Mark Bunting and www.uncommonsenseinvestor.com
Reset and Reload: The Case for Amazon – Uncommon Sense Investor
Analyst: These Five Stocks Have 10-Bagger Potential – Uncommon Sense Investor
Dogs of the Dow 2023: 5 Dividend Stocks to Watch | Kiplinger
5 Undervalued Stocks That Crushed Q3 2022 Earnings | Morningstar
Technical Scores
Calculated as follows:
Intermediate Uptrend based on at least 20 trading days: Score 2
(Higher highs and higher lows)
Intermediate Neutral trend: Score 0
(Not up or down)
Intermediate Downtrend: Score -2
(Lower highs and lower lows)
Outperformance relative to the S&P 500 Index: Score:2
Neutral Performance relative to the S&P 500 Index: 0
Underperformance relative to the S&P 500 Index: Score –2
Above 20 day moving average: Score 1
At 20 day moving average: Score: 0
Below 20 day moving average: –1
Up trending momentum indicators (Daily Stochastics, RSI and MACD): 1
Mixed momentum indicators: 0
Down trending momentum indicators: –1
Technical scores range from -6 to +6. Technical buy signals based on the above guidelines start when a security advances to at least 0.0, but preferably 2.0 or higher. Technical sell/short signals start when a security descends to 0, but preferably -2.0 or lower.
Long positions require maintaining a technical score of -2.0 or higher. Conversely, a short position requires maintaining a technical score of +2.0 or lower
Changes Last Week
Technical Notes for Friday
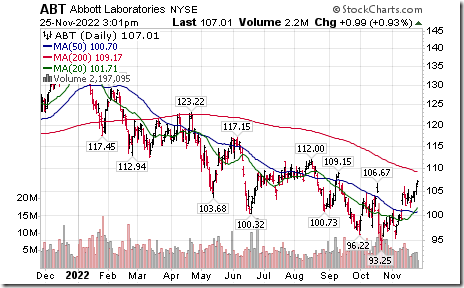
Abbott Labs $ABT an S&P 100 stock moved above intermediate resistance at $106.67
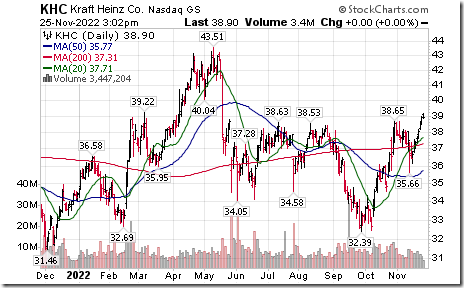
KraftHeinz $KHC an S&P 100 stock moved above intermediate resistance at $38.63.
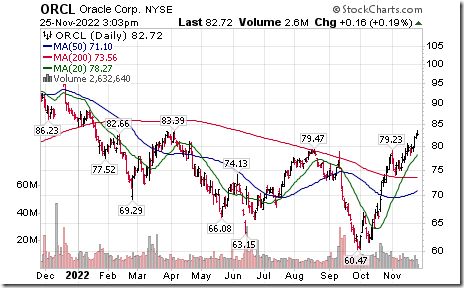
Oracle $ORCL an S&P 100 stock moved above intermediate resistance at $83.39.
TC Energy $TRP a TSX 60 stock moved above intermediate resistance at $65.50.

S&P 500 Momentum Barometers
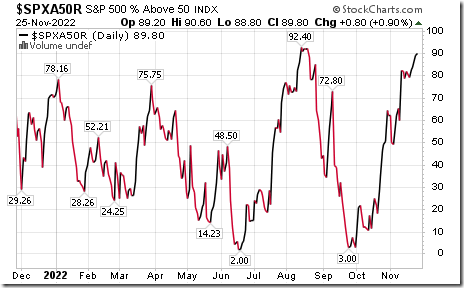
The intermediate term Barometer added 0.80 on Friday and 6.80 last week to 89.80. It remains Overbought. Trend remains up.

The long term Barometer added 2.27 on Friday and 7.00 last week to 63.20. It changed from Neutral to Overbought on a move above 60.00. Trend remains up.
TSX Momentum Barometers
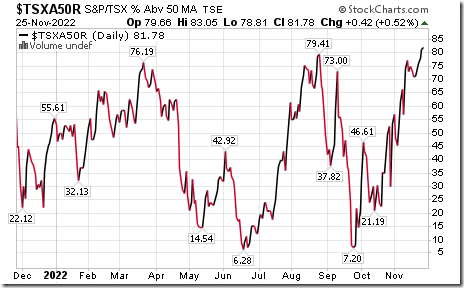
The intermediate term Barometer added 0.42 on Friday and 10.59 last week to 81.78. It remains Overbought. Trend remains up.
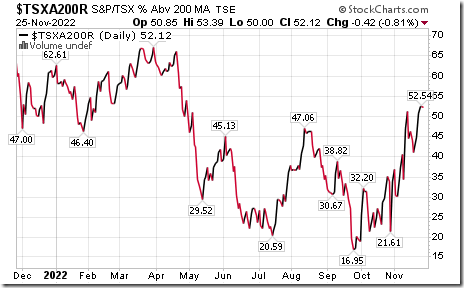
The long term Barometer slipped 0.42 on Friday, but added 8.48 last week to 52.12. It remains Neutral. Trend remains up.
Disclaimer: Seasonality ratings and technical ratings offered in this report and at
www.equityclock.com are for information only. They should not be considered as advice to purchase or to sell mentioned securities. Data offered in this report is believed to be accurate, but is not guaranteed