by Don Vialoux, EquityClock.com
The Bottom Line
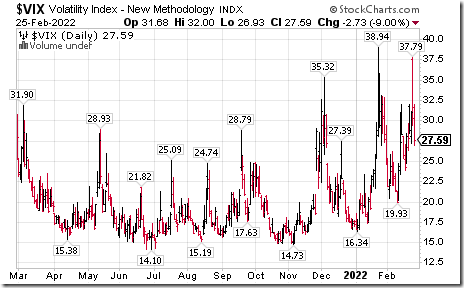
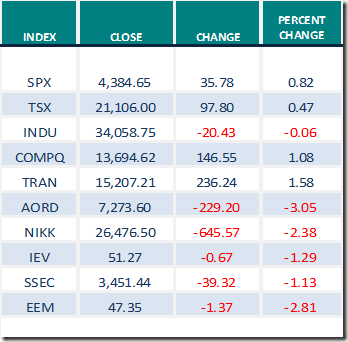
Wild week for equity markets around the world! Indices responded mainly to evolving conditions in Ukraine. The S&P 500 Index traded between 4,114.65 and 4,384.65, a 6.6% range. Many world equity indices broke to two year lows, but recovered strongly on Thursday and Friday. Volatility remained high with the VIX Index reaching a high of 37.79% on Thursday, followed by a drop to 27.59% at the close on Friday
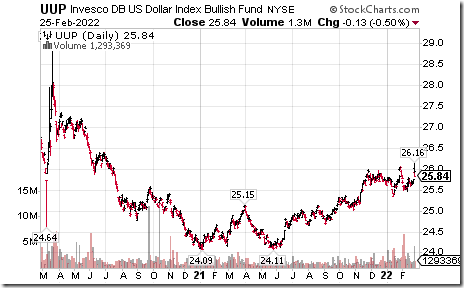
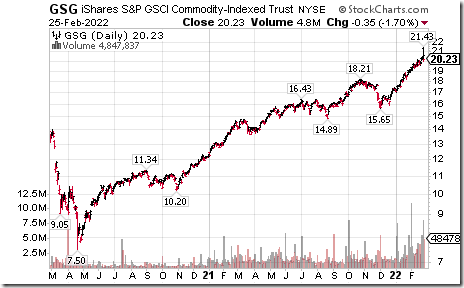
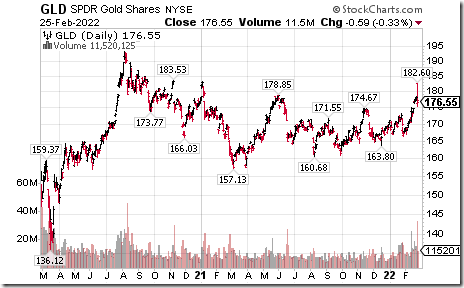
Despite strength in the U.S. Dollar Index and its related ETN: UUP to a two year high, commodity prices (notably crude oil, base metals, steel and grain prices) moved higher. Precious metals prices spiked briefly to multi-year highs on Thursday before moving lower on Thursday and Friday.
Where to next? The conflict in Ukraine is far from over. Look for volatility to remain at high levels. Watch the VIX Index for clues to the next intermediate trend for world equity markets. A significant drop in the VIX Index from current levels is bullish. A significant increase from current levels will trigger renewed selling pressures.
Observations
Consensus earnings and revenue estimates on a year-over-year basis for S&P 500 companies for the fourth quarter of 2021 were virtually unchanged last week: 95% of companies have released results to date with 76% reporting higher than consensus earnings and 78% reporting higher than consensus revenues. According to www.FactSet.com earnings on a year-over-year basis in the fourth quarter are projected to increase 30.7% versus a gain of 30.9% reported last week. Revenues are projected to increase 15.9% versus a gain of 15.5 last week.
Consensus earnings estimates for S&P 500 companies on a year-over-year basis in the first quarter of 2022 were reduced slightly again: 62 companies issued negative guidance and 26 companies issued positive guidance. According to www.FactSet.com first quarter earnings on a year-over-year basis are expected to increase 4.6% (versus 5.2% last week) and revenues are expected to increase 10.2% (versus 10.3% last week).
Consensus estimates for S&P 500 companies beyond the first quarter on a year-over-year basis increased slightly. According to www.FactSet.com second quarter earnings are expected to increase 4.4% (versus 4.7% last week) and revenues are expected to increase 8.6%. Earnings on a year-over-year basis for all of 2022 are expected to increase 8.5% (versus 8.6% last week) and revenues are expected to increase 8.1% (versus 8.0% last week).
Economic News This Week
February Chicago PMI to be released at 9:45 AM EST on Monday is expected to slip to 63.9 from 65.2 in January.
Canadian December GDP to be released at 8:30 AM EST on Tuesday is expected to increase 0.3% versus a gain of 0.6% in November. Fourth quarter GDP is expected to increase 3.0% versus a gain of 5.4% in the third quarter.
January Construction Spending to be released at 10:00 AM EST on Tuesday is expected to slip 0.2% versus a gain of 0.2% in December.
February ISM Manufacturing PMI to be released at 10:00 AM EST on Tuesday is expected to increase to 57.9 from 57.6 in January.
State of the Union address by President Biden is released on Tuesday evening.
February ADP Non-farm Employment to be released at 8:15 AM EST on Wednesday is expected to increase to 320,000 from 301,000 in January.
Bank of Canada interest rate statement to be released at 10:00 AM EST on Wednesday is expected to include an increase in the rate for Canada’s major banks from 0.25% to 0.50%.
Fourth quarter Non-farm Productivity to be released at 8:30 AM EST on Thursday is expected to increase 6.5% versus a gain of 6.6% in the third quarter.
January Factory Orders to be released at 10:00 AM EST on Thursday are expected to increase 0.5% versus a decline of 0.4% in December.
Federal Reserve Chairman Powell testifies.at 10:00 AM EST on Thursday
February ISM Non-manufacturing PMI to be released at 10:00 AM EST on Thursday is expected to slip to 60.5 from 59.9 in January.
Bank of Canada’s Macklen speaks at 11:30 AM EST
February Non-farm Payrolls to be released at 8:30 AM EST on Friday is expected to increase 438,000 versus a gain of 467,000 in January. February Unemployment Rate is expected to slip to 3.9% from 4.0% in January. February Average Hourly Earnings are expected to increase 0.6% versus a gain of 0.7% in January.
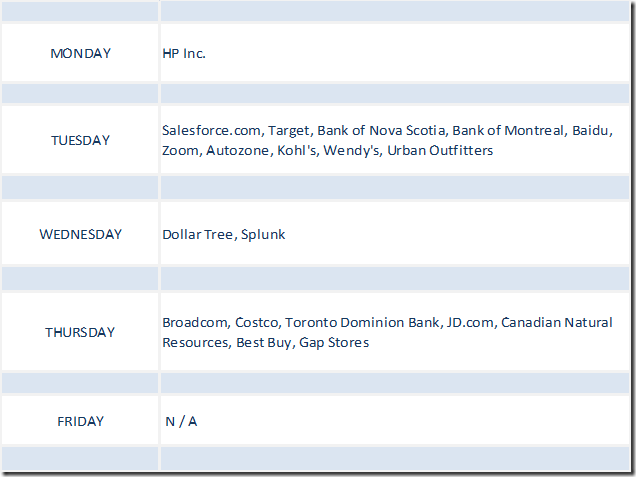
Selected Earnings News This Week
Trader’s Corner
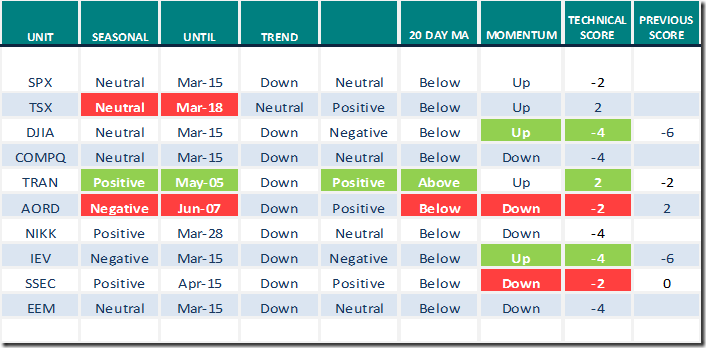
Equity Indices and Related ETFs
Green: Increase from previous day
Red: Decrease from previous day
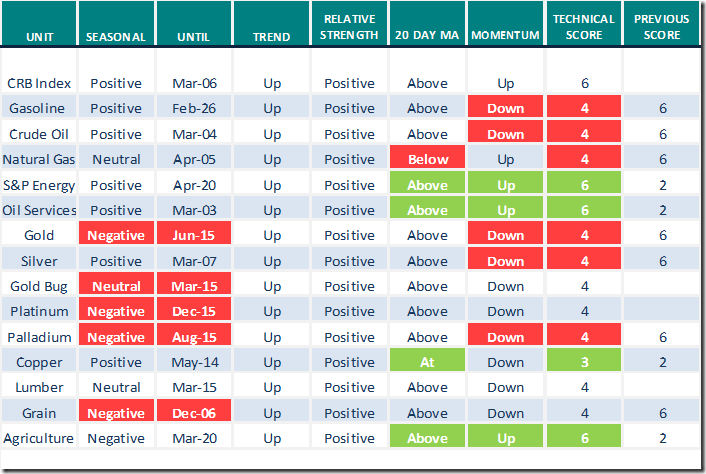
Commodities
Daily Seasonal/Technical Commodities Trends for Feb.25th 2022
Green: Increase from previous day
Red: Decrease from previous day
Sectors
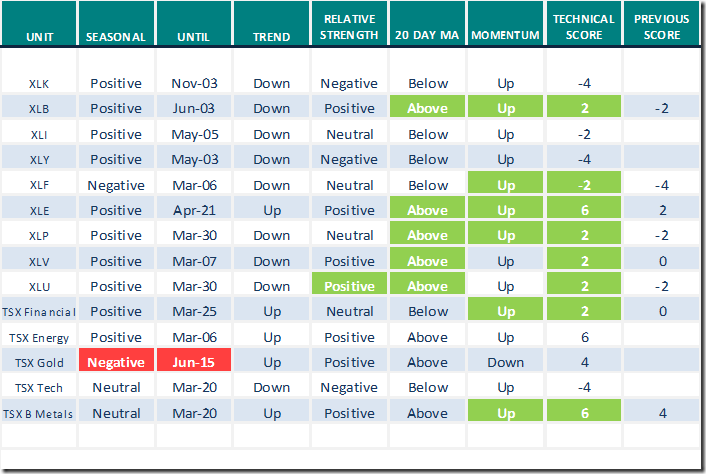
Daily Seasonal/Technical Sector Trends for Feb.25th 2021
Green: Increase from previous day
Red: Decrease from previous day
All seasonality ratings are based on performance relative to the S&P 500 Index (except TSX)
Links from valued providers
Greg Schnell’s thoughts on “What’s working religion”.
The What’s Working Religion | The Canadian Technician | StockCharts.com
Mark Leibovit’s Weekly Comment
https://www.howestreet.com/2022/02/trucker-freedom-convoy-cryptos-inflation-nfts-mark-leibovit/
Michael Campbell’s Weekly Money Talks
February 26th Episode (mikesmoneytalks.ca)
Mish Schneider from www.StockCharts.com sees “Signs of a market bottom”
https://www.youtube.com/watch?v=4m9c8FOU3hM
Tom Bowley from www.stockcharts.com notes that the U.S. Defense sector has come alive
Breakouts Galore in This Suddenly Surging Industry | ChartWatchers | StockCharts.com
Julius de Kempenaer from www.stockcharts.com notes “Huge market rotation in world equity markets with Canada and Indonesia leading on the upside”
Waking Up in Europe on Thursday Morning | ChartWatchers | StockCharts.com
Mary Ellen McGonigal from www.stockcharts.com discusses “How to take advantage of expected shortages amidst Russia/Ukraine crisis”.
Links offered by Mark Bunting and www.uncommonsenseinvestor.com
David Frum on "The Coming Energy Shock" – Uncommon Sense Investor
Two Robotics Companies Benefitting from Acceleration in Elective Surgeries – Uncommon Sense Investor
5 Great Green Stocks Making a Direct Impact | Kiplinger
It’s Ugly Out There – The Irrelevant Investor
Weekly Technical Scoop from David Chapman and www.EnrichedInvesting.com
Technical Scores
Calculated as follows:
Intermediate Uptrend based on at least 20 trading days: Score 2
(Higher highs and higher lows)
Intermediate Neutral trend: Score 0
(Not up or down)
Intermediate Downtrend: Score -2
(Lower highs and lower lows)
Outperformance relative to the S&P 500 Index: Score: 2
Neutral Performance relative to the S&P 500 Index: 0
Underperformance relative to the S&P 500 Index: Score –2
Above 20 day moving average: Score 1
At 20 day moving average: Score: 0
Below 20 day moving average: –1
Up trending momentum indicators (Daily Stochastics, RSI and MACD): 1
Mixed momentum indicators: 0
Down trending momentum indicators: –1
Technical scores range from -6 to +6. Technical buy signals based on the above guidelines start when a security advances to at least 0.0, but preferably 2.0 or higher. Technical sell/short signals start when a security descends to 0, but preferably -2.0 or lower.
Long positions require maintaining a technical score of -2.0 or higher. Conversely, a short position requires maintaining a technical score of +2.0 or lower
Changes Last Week
Technical Notes released on Friday at
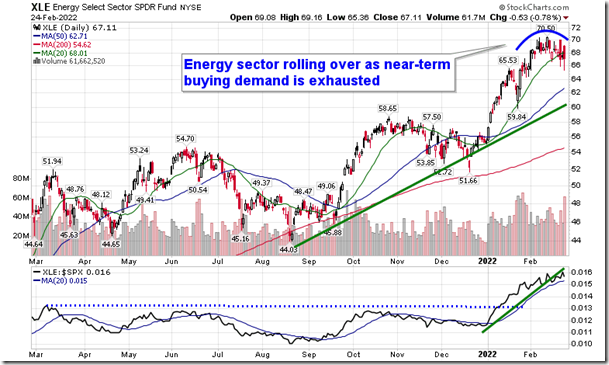
Value over growth trade coming to an end? equityclock.com/2022/02/24/… $XLE $XLF $SPX $NYA $VUG $VTV
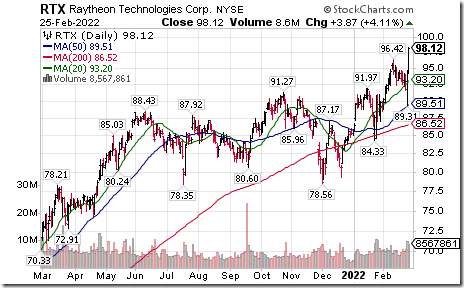
Raytheon Technologies $RTX an S&P 100 stock moved above $96.42 to an all-time high extending an intermediate uptrend.
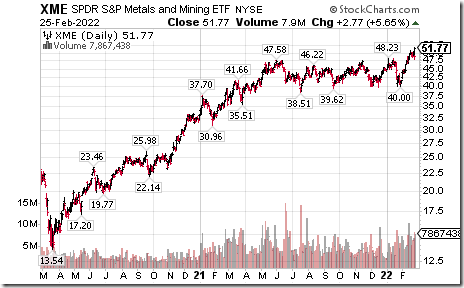
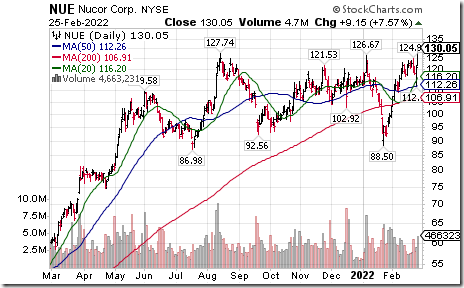
U.S. steel stocks and related ETFs $SLX $XME are notable higher today. Nice breakouts by $STLD $NUE $X They are responding to the U.S. infrastructure theme! Seasonal influences for the sector are favourable to early June. If a subscriber to EquityClock, see seasonality chart on Nucor at https://charts.equityclock.com/nucor-corporation-nysenue-seasonal-chart
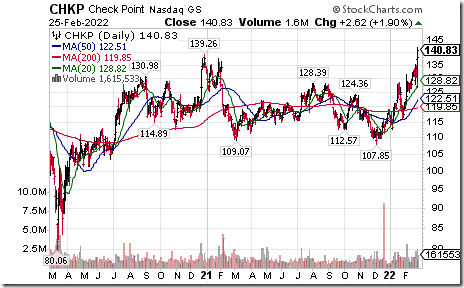
Check Point Software $CHKP moved above $139.26 to an all-time high extending an intermediate uptrend.
S&P 500 Momentum Barometers
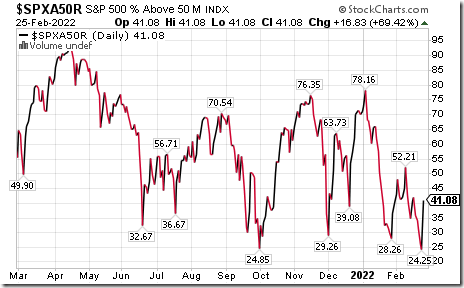
The intermediate term Barometer added 16.83 on Friday and 6.81 last week to 41.08%. It changed on Friday from Oversold to Neutral on a recovery above 40.00.
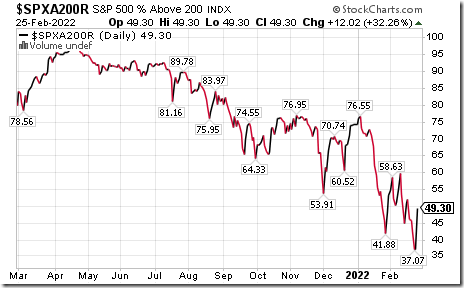
The long term Barometer advanced 12.02 on Friday and 3.61 last week to 49.30%. It remains Neutral.
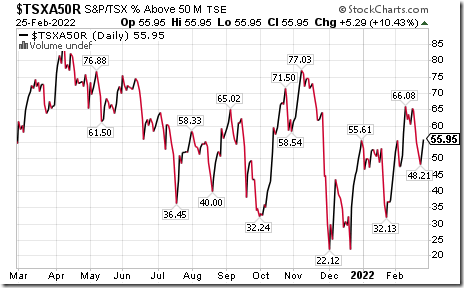
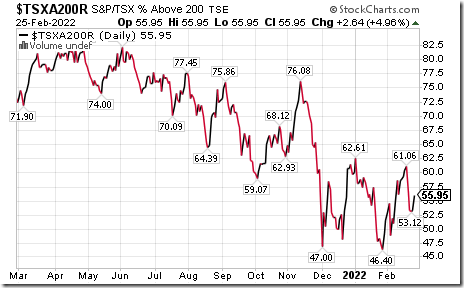
TSX Momentum Barometers
The intermediate term Barometer added 5.29 on Friday and 0.88 last week to 55.95%. It remains Neutral.
The long term Barometer added 2.64 on Friday and slipped 0.44 last week to 55.95%. It remains Neutral.
Disclaimer: Seasonality and technical ratings offered in this report and at
www.equityclock.com are for information only. They should not be considered as advice to purchase or to sell mentioned securities. Data offered in this report is believed to be accurate, but is not guaranteed
This post was originally publised at Vialoux's Tech Talk.


