by Don Vialoux, EquityClock.com
Technical Notes released yesterday at
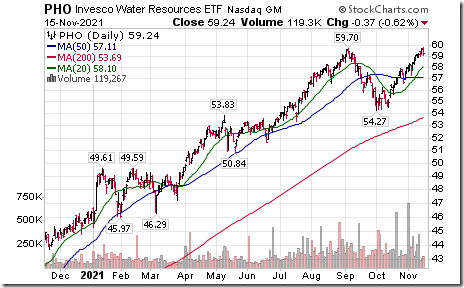
Water Resources ETF $PHO moved above $59.70 to an all-time high extending an intermediate uptrend. Seasonal influences are favourable on a real and relative basis until the end of April. If a subscriber to EquityClock, see: https://charts.equityclock.com/invesco-water-resources-etf-nasdpho-seasonal-chart
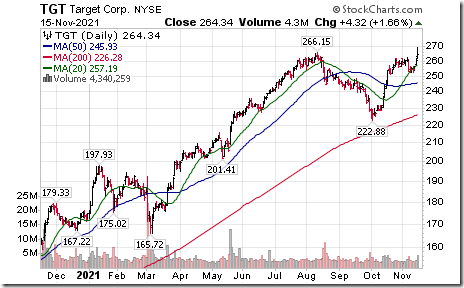
Target $TGT an S&P 100 stock moved above $266.15 to an all-time high extending an intermediate uptrend.
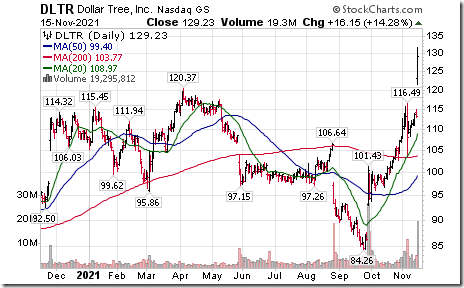
Dollar Tree $DLTR a NASDAQ 100 stock moved above $120.37 extending an intermediate uptrend. Subject to an activist position in the stock
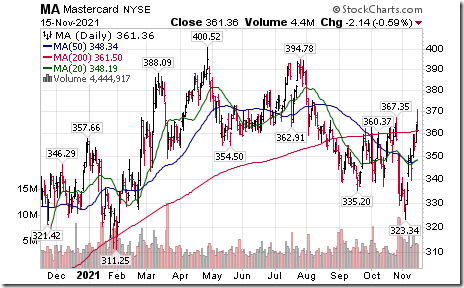
MasterCard $MA an S&P 100 stock moved above intermediate resistance at $367.35. Seasonal influences are favourable until at least the end of April. If a subscriber to EquityClock, see:
https://charts.equityclock.com/mastercard-nysema-seasonal-chart
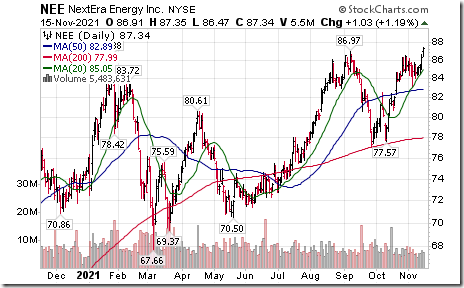
NextEra Energy $NEE an S&P 100 stock moved above $86.97 to an all-time high extending an intermediate uptrend.
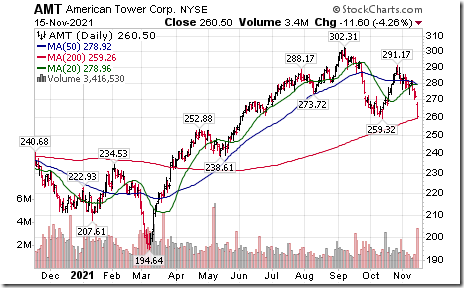
American Tower $AMT an S&P 100 stock moved below $259.32 extending an intermediate downtrend.
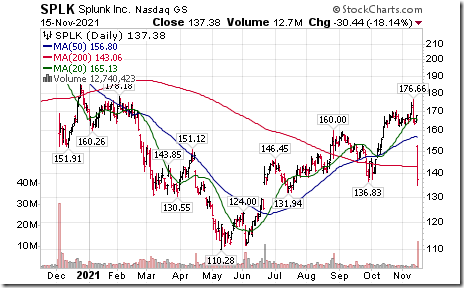
Splunk $SPLK a NASDAQ 100 stock moved below support at $136.83
Trader’s Corner
Equity Indices and Related ETFs
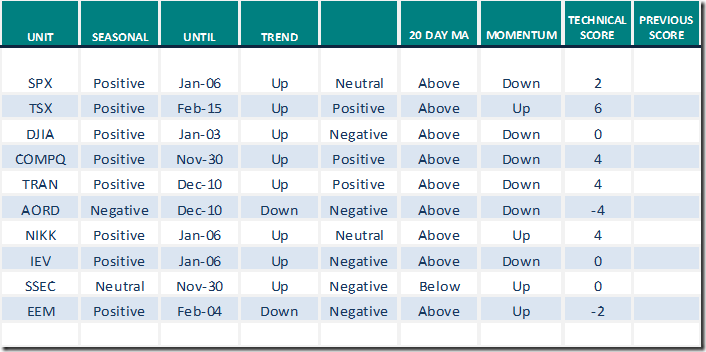
Daily Seasonal/Technical Equity Trends for Nov.15th 2021
Green: Increase from previous day
Red: Decrease from previous day
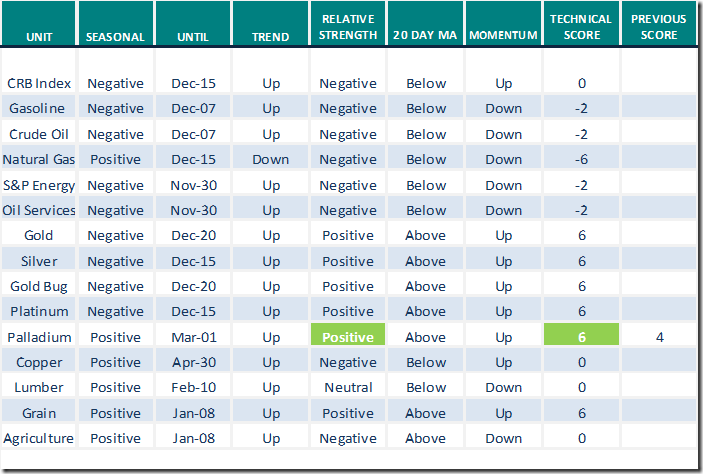
Commodities
Daily Seasonal/Technical Commodities Trends for Nov.15th 2021
Green: Increase from previous day
Red: Decrease from previous day
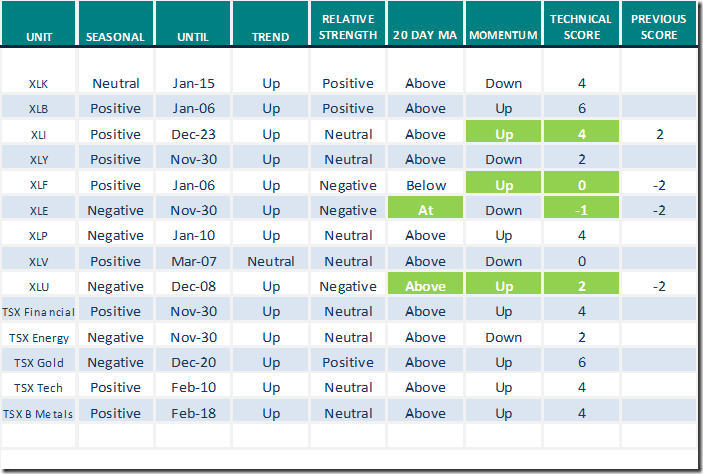
Sectors
Daily Seasonal/Technical Sector Trends for Nov.15th 2021
Green: Increase from previous day
Red: Decrease from previous day
All seasonality ratings are based on performance relative to the S&P 500 Index (except TSX).
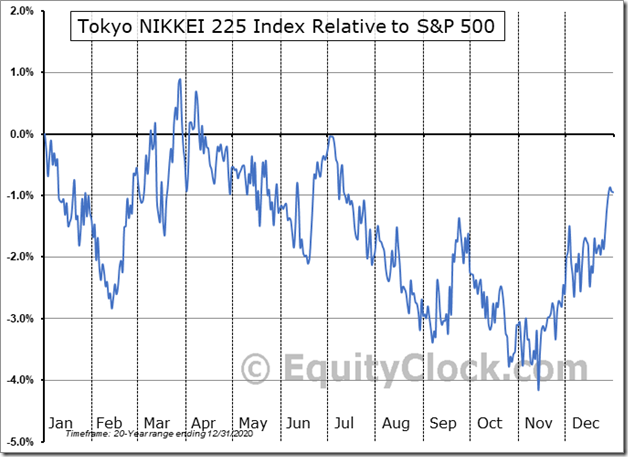
Seasonality Chart of the Day from www.EquityClock.com
Seasonal influences on a real and relative basis for the Nikkei Average are positive from mid-November to the first week in January.
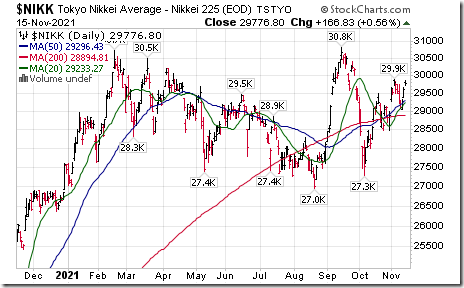
The Nikkei Average reached an intermediate low on October 6th. The Average recently moved above its 200 day moving average and yesterday it moved above its 20 and 50 day moving averages. Strength relative to the S&P 500 Index has just turned positive. Momentum is positive.
S&P 500 Momentum Barometers
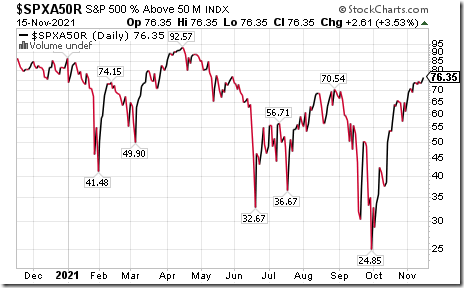
The intermediate term Barometer increased 2.61 to 76.25 yesterday. It remains Overbought and continues to trend higher.
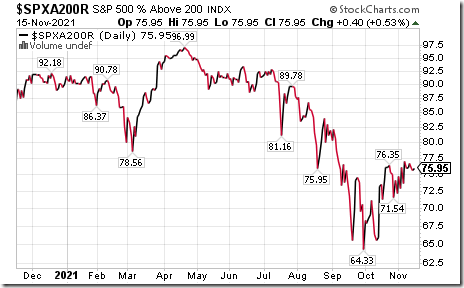
The long term Barometer added 0.40 to 75.95 yesterday. It remains Overbought
TSX Momentum Barometers
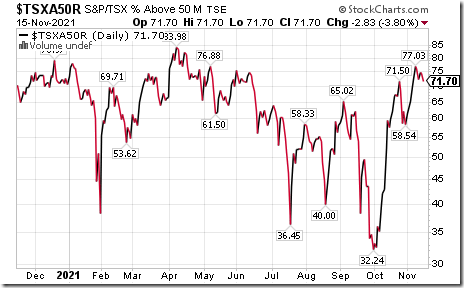
The intermediate term Barometer slipped 2.83 to 71.70 yesterday. It remains Overbought.
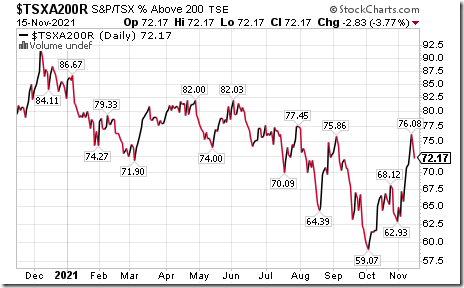
The long term Barometer dropped 2.83 to 72.17 yesterday. It remains Overbought.
Disclaimer: Seasonality and technical ratings offered in this report and at
www.equityclock.com are for information only. They should not be considered as advice to purchase or to sell mentioned securities. Data offered in this report is believed to be accurate, but is not guaranteed
This post was originally publised at Vialoux's Tech Talk.


