


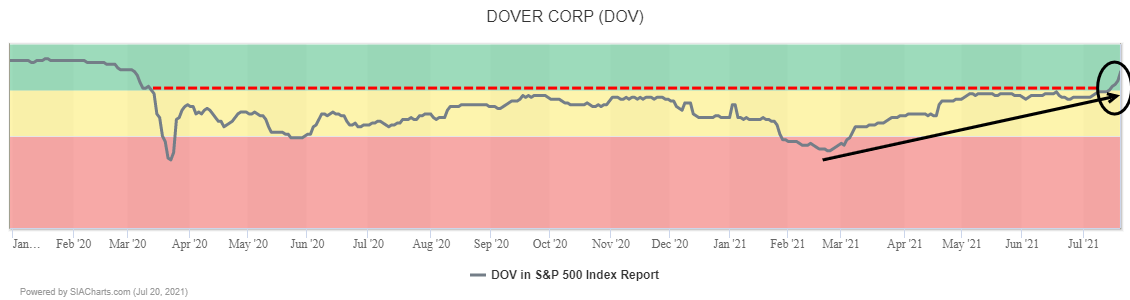
Industrial products manufacturer Dover Corp. (DOV) recently returned to the Green Favored Zone of the SIA S&P 500 Index Report for the first time since March of 2020 and continues to climb up the rankings. Yesterday it finished in 75th place up 23 spots on the day and up 69 places in the last month.
Dover Corp. (DOV) staged a major breakout yesterday, blasting through the top of a $143 to $155 consolidation range which had been in place since April to a new all-time high. This move occurred on a spike in volume, indicating increased investor interest and the start of a new advance.
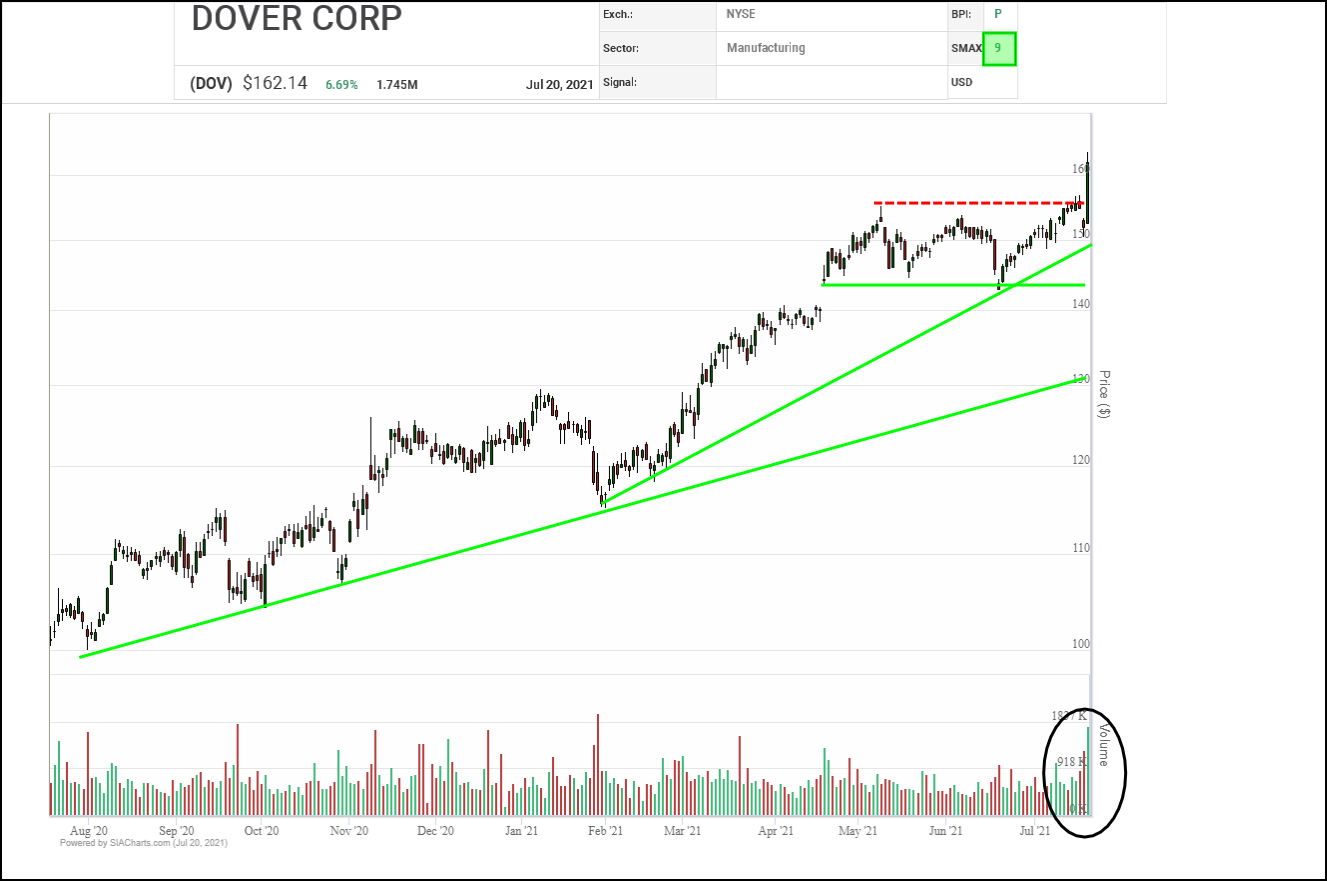
Measured moves from the previous range suggest potential resistance near $167 then $179 and $191 on trend. Initial support appears near the $155 breakout point.
Since bottoming out in March of 2020, Dover Corp. (DOV) shares have been under steady accumulation, advancing in a steady uptrend of higher lows and positive pattern completions. A high pole advance from March to June was followed by only a minor 3-box correction before resuming its primary upward course with a Double Top breakout.
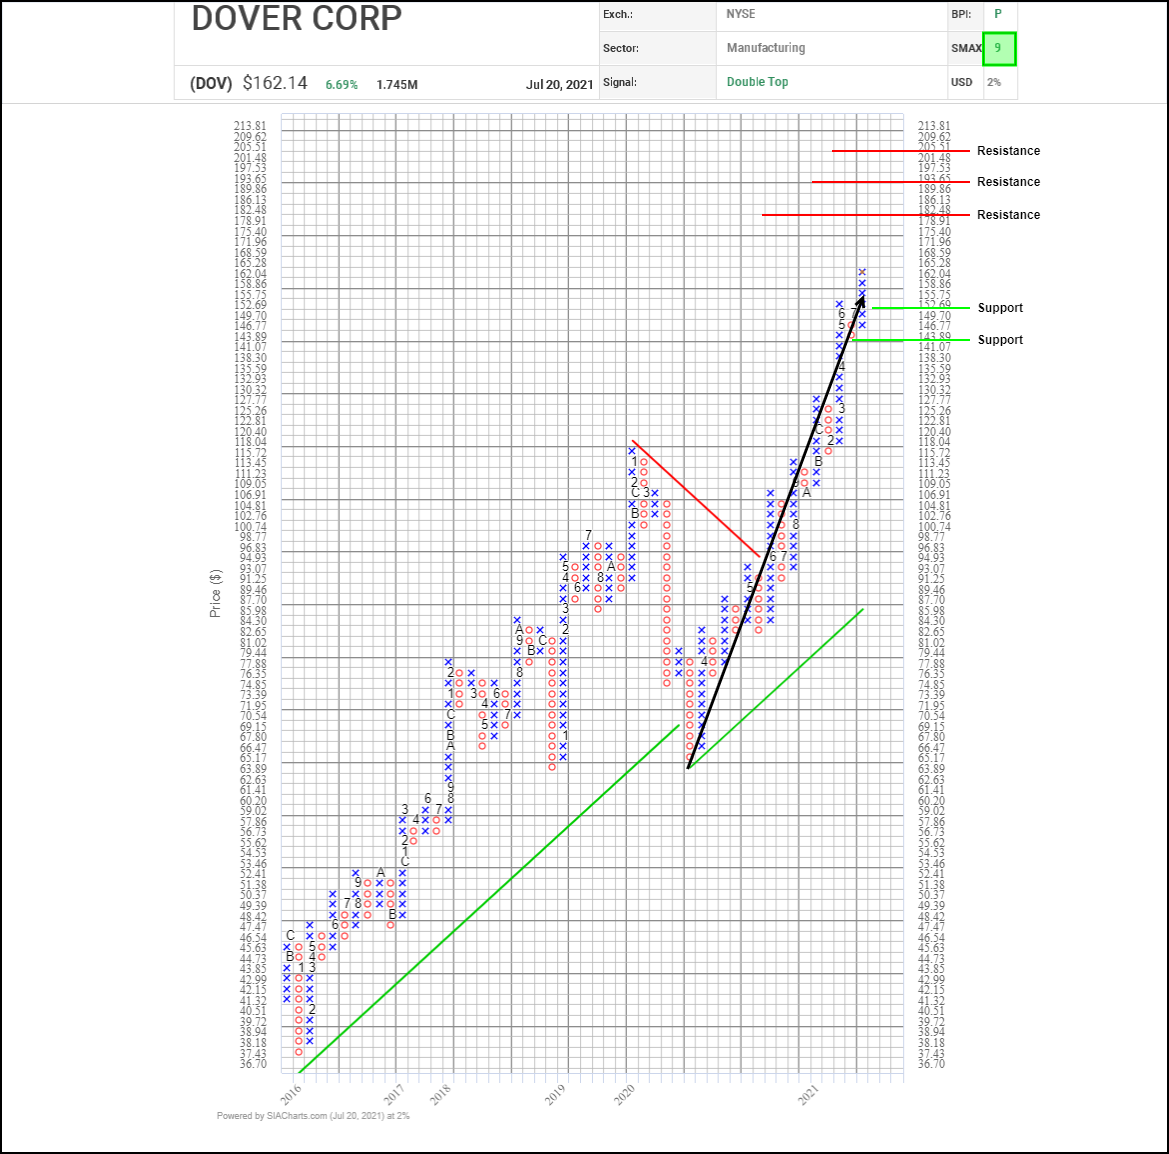
Based on vertical and horizontal counts, next potential upside resistance on trend appears near $182.50, $193.65, and $205.50 along with the $200.00 round number. Initial support appears near $149.70, just below the $150.00 round number, based on a common 3-box reversal.
With a bullish SMAX score of 9, DOV is exhibiting strength against the asset classes.
Disclaimer: SIACharts Inc. specifically represents that it does not give investment advice or advocate the purchase or sale of any security or investment whatsoever. This information has been prepared without regard to any particular investors investment objectives, financial situation, and needs. None of the information contained in this document constitutes an offer to sell or the solicitation of an offer to buy any security or other investment or an offer to provide investment services of any kind. As such, advisors and their clients should not act on any recommendation (express or implied) or information in this report without obtaining specific advice in relation to their accounts and should not rely on information herein as the primary basis for their investment decisions. Information contained herein is based on data obtained from recognized statistical services, issuer reports or communications, or other sources, believed to be reliable. SIACharts Inc. nor its third party content providers make any representations or warranties or take any responsibility as to the accuracy or completeness of any recommendation or information contained herein and shall not be liable for any errors, inaccuracies or delays in content, or for any actions taken in reliance thereon. Any statements nonfactual in nature constitute only current opinions, which are subject to change without notice.