
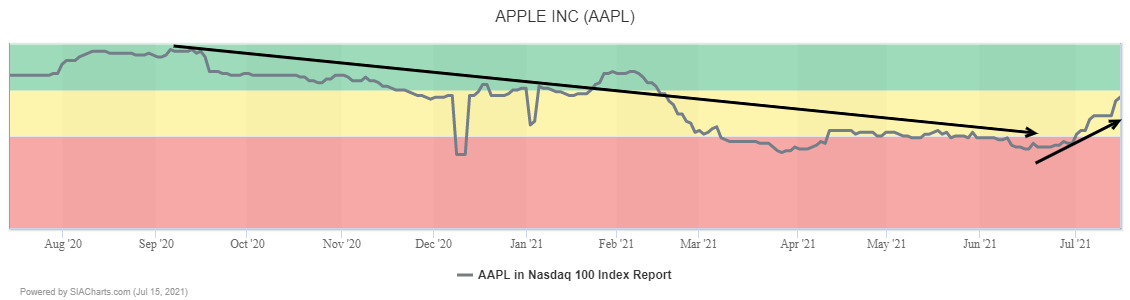
Apple (AAPL) tumbled out of the green zone within the SIA NASDAQ 100 Index Report but appears to be getting close to a return with the shares climbing up out of the red zone and toward the top of the Yellow Neutral Zone over the last few days. Yesterday, Apple finished in 30th place, 4 spots outside of the green zone, after climbing 2 spots on the day and rising 29 places in the last month.
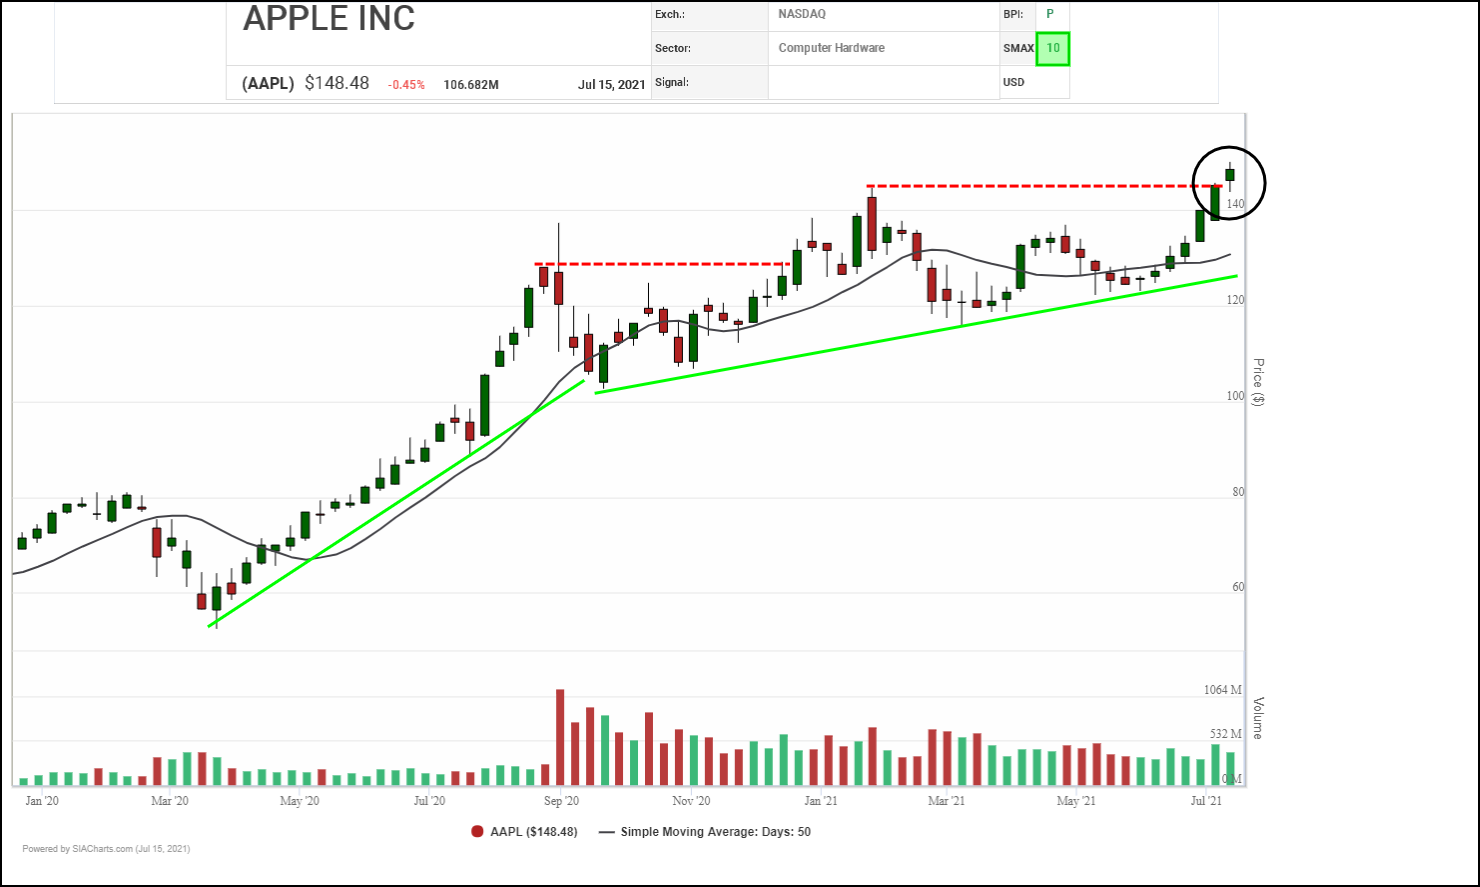
A major breakout is underway in Apple (AAPL) this week with the shares blasting through $145 to a new all time high, with the completion of a bullish Ascending Triangle ending a consolidation phase and signaling the start of a new advance. This move also indicates that the uptrend which started back in March of 2020 but slowed earlier this year has resumed in earnest.
Some initial resistance may appear near $150 where a round number and an older measured move converge but measuring from the more recent triangle suggests that $172 could potentially be tested over time. Initial support appears near $140.
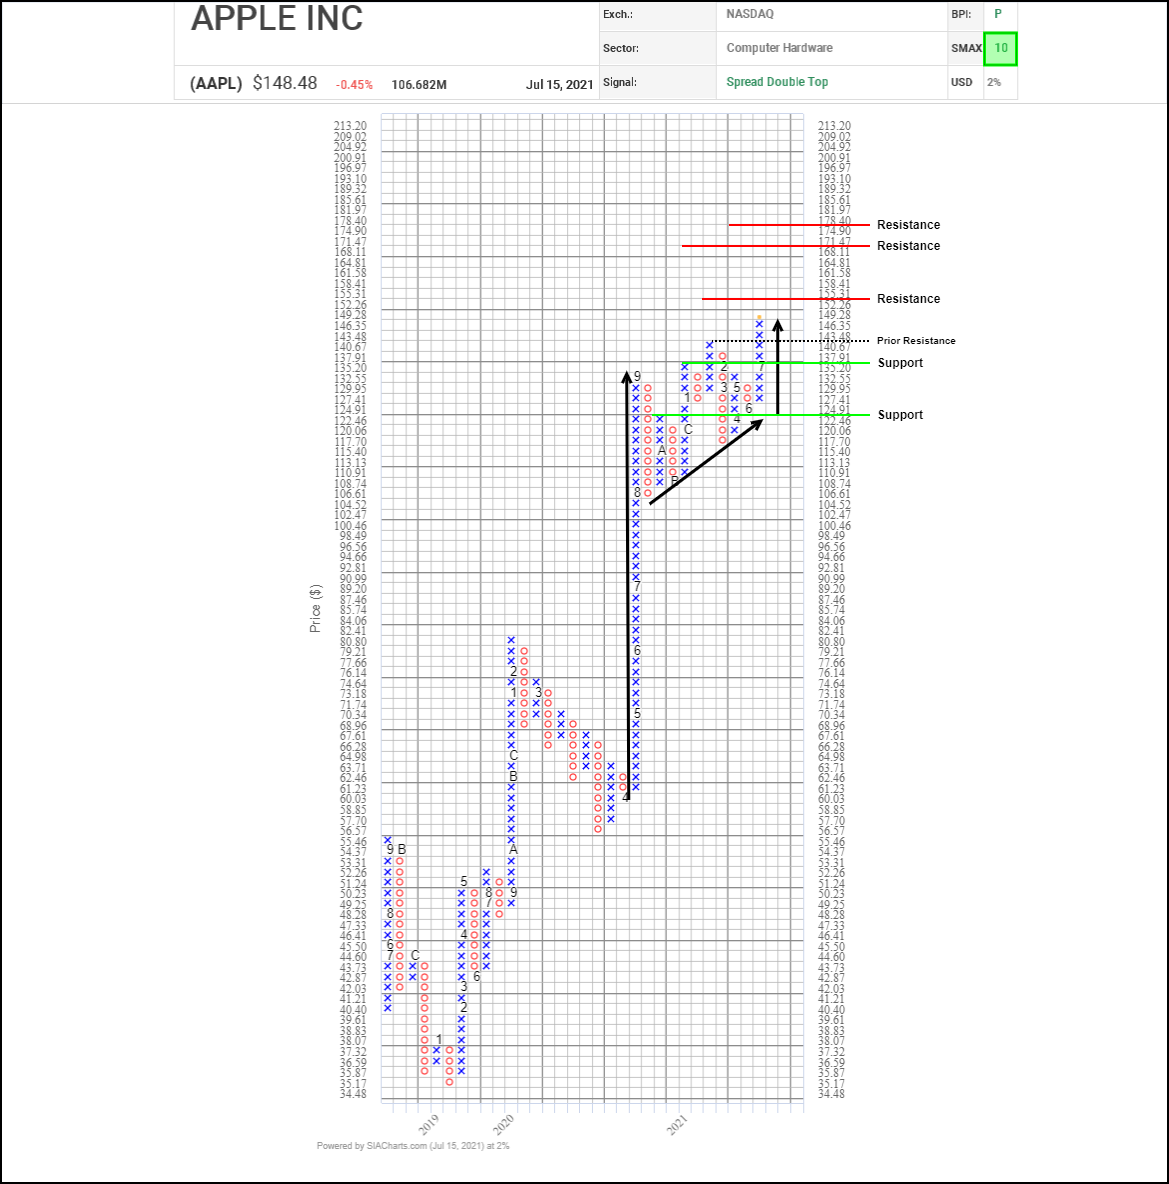
Although its upward momentum slowed following the completion of a major high pole rally back in September, a continuing series of higher lows indicated continuing investor support for Apple while it consolidated its gains. This month, accumulation has started to accelerate once again, with the shares breaking through their January peak to a new all-time high, completing a bullish Spread Double Top pattern and signaling the start of a new advance
Vertical and horizontal counts suggest potential upside resistance on trend near $155.30, $171.45 and $178.40. Initial support appears near $135.20 based on a 3-box reversal.
With a perfect SMAX score of 10, AAPL is exhibiting strength across the asset classes.
Disclaimer: SIACharts Inc. specifically represents that it does not give investment advice or advocate the purchase or sale of any security or investment whatsoever. This information has been prepared without regard to any particular investors investment objectives, financial situation, and needs. None of the information contained in this document constitutes an offer to sell or the solicitation of an offer to buy any security or other investment or an offer to provide investment services of any kind. As such, advisors and their clients should not act on any recommendation (express or implied) or information in this report without obtaining specific advice in relation to their accounts and should not rely on information herein as the primary basis for their investment decisions. Information contained herein is based on data obtained from recognized statistical services, issuer reports or communications, or other sources, believed to be reliable. SIACharts Inc. nor its third party content providers make any representations or warranties or take any responsibility as to the accuracy or completeness of any recommendation or information contained herein and shall not be liable for any errors, inaccuracies or delays in content, or for any actions taken in reliance thereon. Any statements nonfactual in nature constitute only current opinions, which are subject to change without notice.