


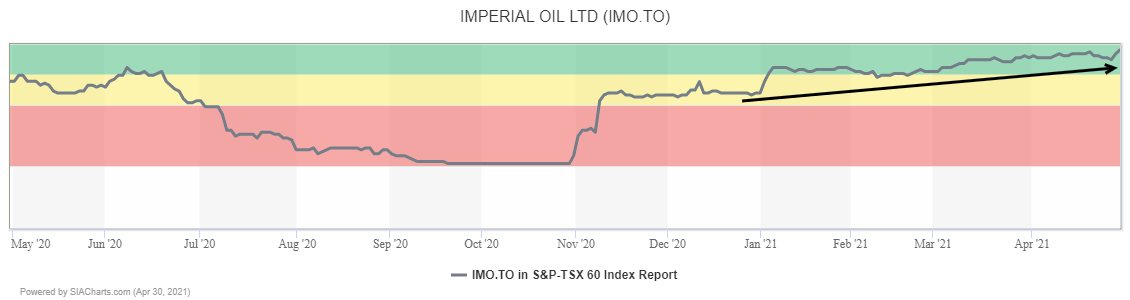
Since we last mentioned Imperial Oil (IMO.TO) in the March 12th edition of the Daily Stock Report, the shares are up 10.7%, including a 4.8% gain on Friday after the energy producer reported improved earnings and raised its dividend. The shares continue to climb within the Green Favored Zone of the SIA S&P/TSX 60 Index Reports rising 2 spots on Friday to 3rd place.
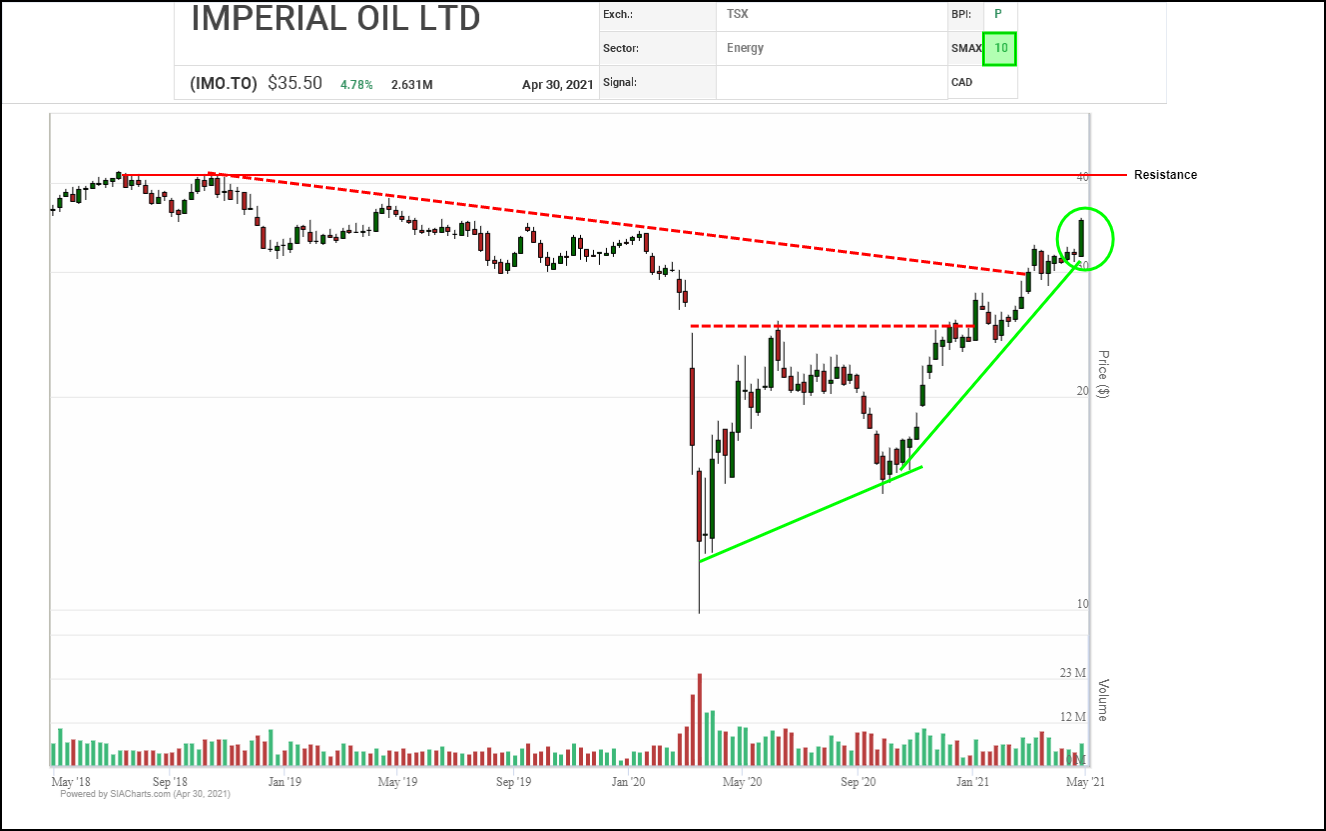
Building on the completion of a bullish Ascending Triangle base last year, earlier this year, Imperial Oil (IMO.TO) shares snapped a downtrend line with a breakout over $30.00. After spending about six weeks establishing that $30.00 has reversed polarity to become support, accumulation accelerated with the shares breaking through $32.50 to their highest level in over a year and signaling the start of a new upleg.
Based on a measured move from the triangle, initial upside resistance appears near $38.50 followed by the $40.00 round number, the previous peak near $41.50 and then a measured $47.50 on trend. Initial support moves up to the $32.50 breakout point from $30.00.
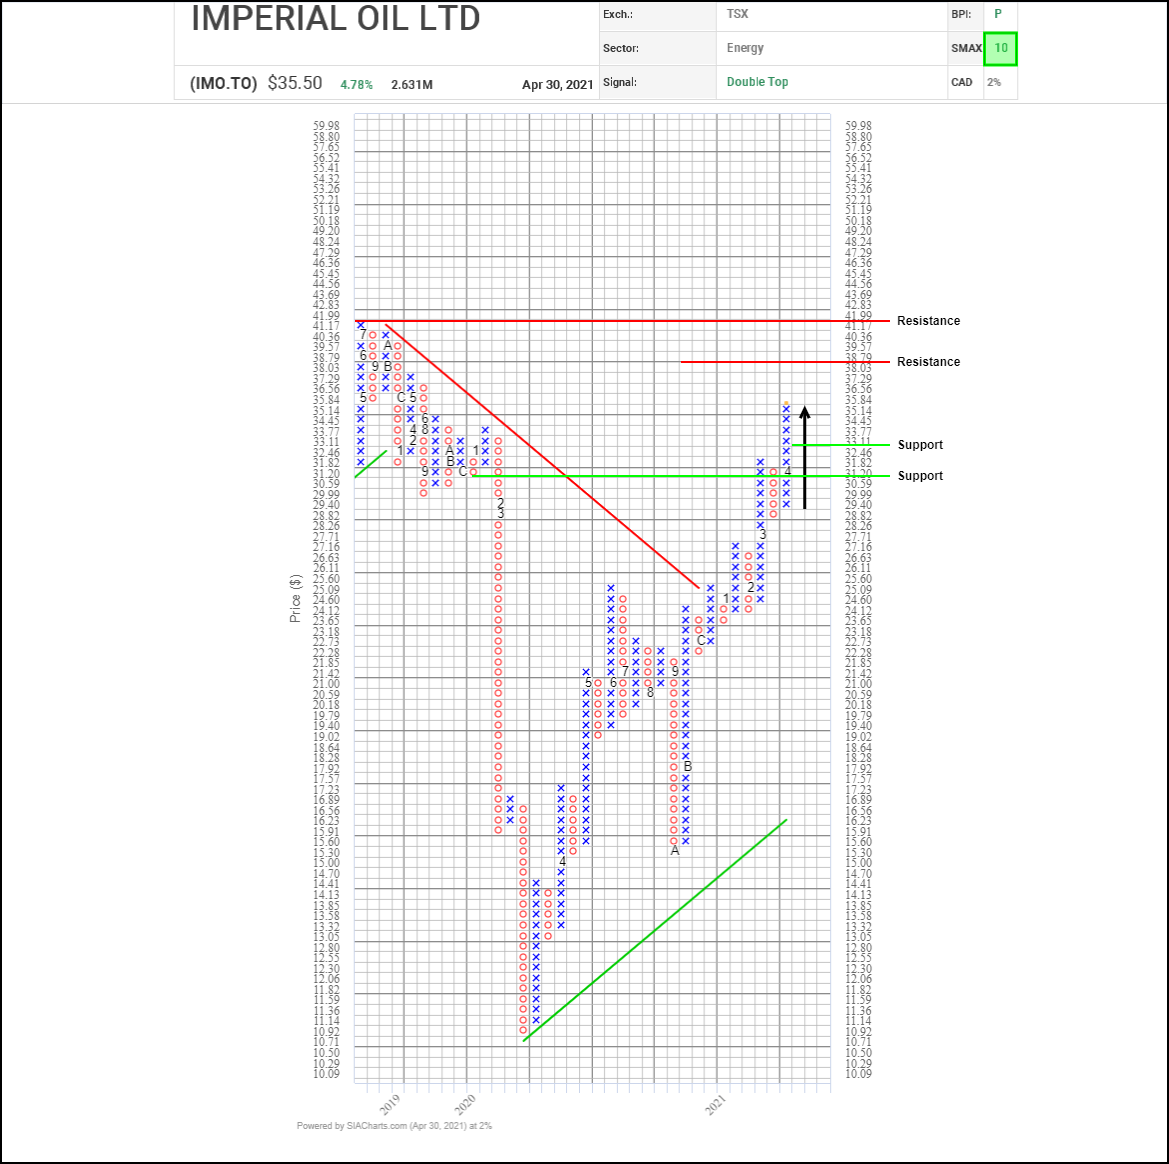
Imperial Oil (IMO.TO) shares recently completed a bullish Double Top breakout, confirming and continuing an upward trend which started back in October, that includes consistently higher lows, positive pattern completions and the snapping of a previous downtrend line.
A vertical count suggests initial resistance may appear near $38.80, followed by the $40.00 round number and the $41.15 to $42.85 where a previous high clusters with vertical and horizontal counts. Initial support appears near $32.45 based on a 3-box reversal.
With a perfect SMAX score of 10, IMO.TO is exhibiting near-term strength across the asset classes.
Disclaimer: SIACharts Inc. specifically represents that it does not give investment advice or advocate the purchase or sale of any security or investment whatsoever. This information has been prepared without regard to any particular investors investment objectives, financial situation, and needs. None of the information contained in this document constitutes an offer to sell or the solicitation of an offer to buy any security or other investment or an offer to provide investment services of any kind. As such, advisors and their clients should not act on any recommendation (express or implied) or information in this report without obtaining specific advice in relation to their accounts and should not rely on information herein as the primary basis for their investment decisions. Information contained herein is based on data obtained from recognized statistical services, issuer reports or communications, or other sources, believed to be reliable. SIACharts Inc. nor its third party content providers make any representations or warranties or take any responsibility as to the accuracy or completeness of any recommendation or information contained herein and shall not be liable for any errors, inaccuracies or delays in content, or for any actions taken in reliance thereon. Any statements nonfactual in nature constitute only current opinions, which are subject to change without notice.