

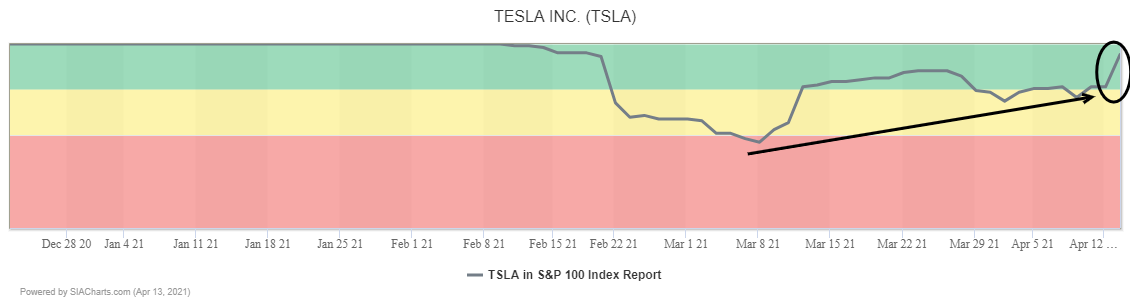
Green vehicle producer Tesla (TSLA) continues to climb its way back up the rankings in the SIA S&P 100 Index Report, returning to the Green Favored Zone from recent dips into the red and yellow zones. Yesterday it moved up 18 spots to 7th place.
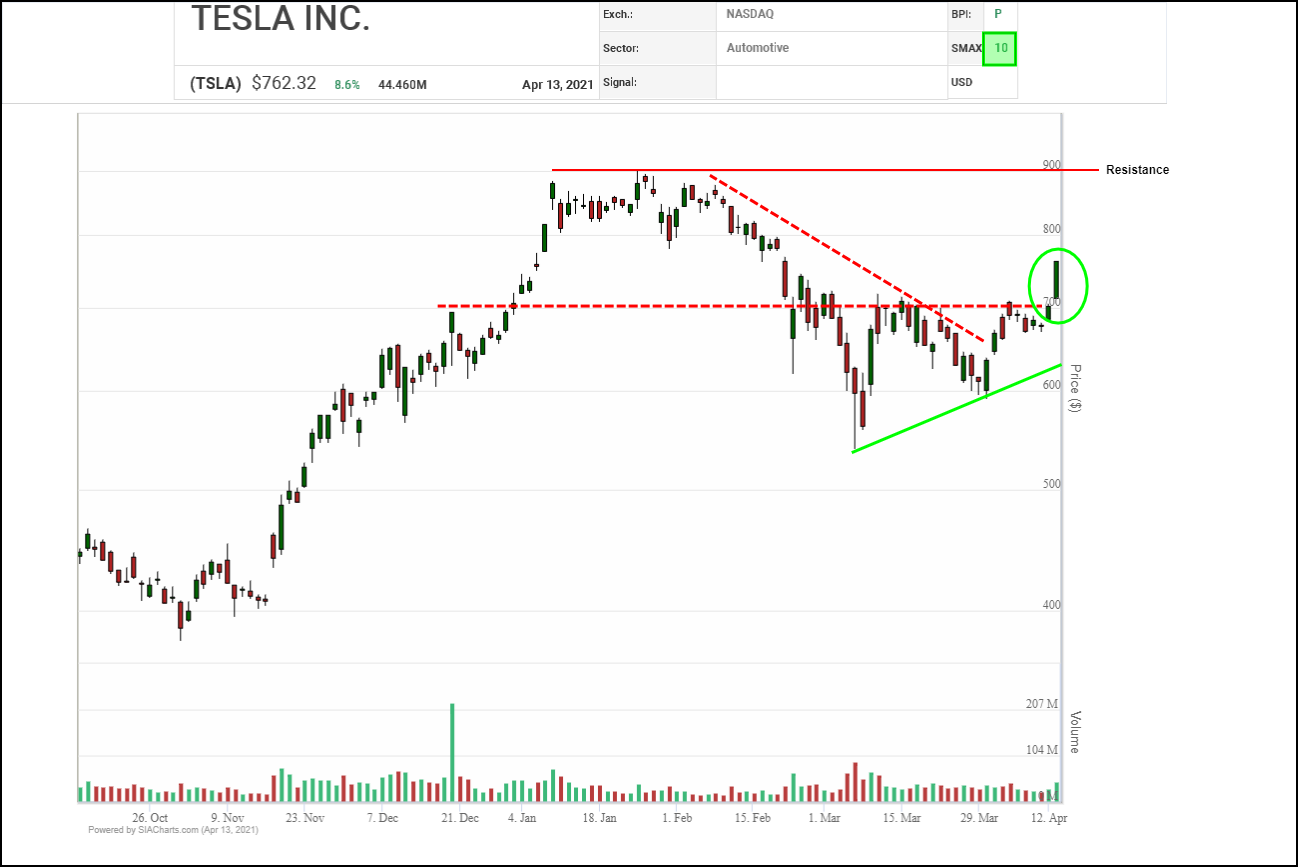
At the start of this month, Tesla (TSLA) shares snapped a downtrend line, indicating accumulation was resuming, and yesterday, they confirmed that an upswing is underway with a decisive breakout on an uptick in volume over the $700 round number, which completed a bullish Ascending Triangle base.
Initial upside resistance appears near the $800 and $900 round numbers, the boundaries of a trading range which persisted through January and part of February, with $900 also aligning with a measured move from the triangle. A breakout there to a new high would confirm that the long-term uptrend has resumed with next potential resistance possible near $1,000 where a round number and multiple measured moves converge. Initial support appears at the $700 round number and breakout point.
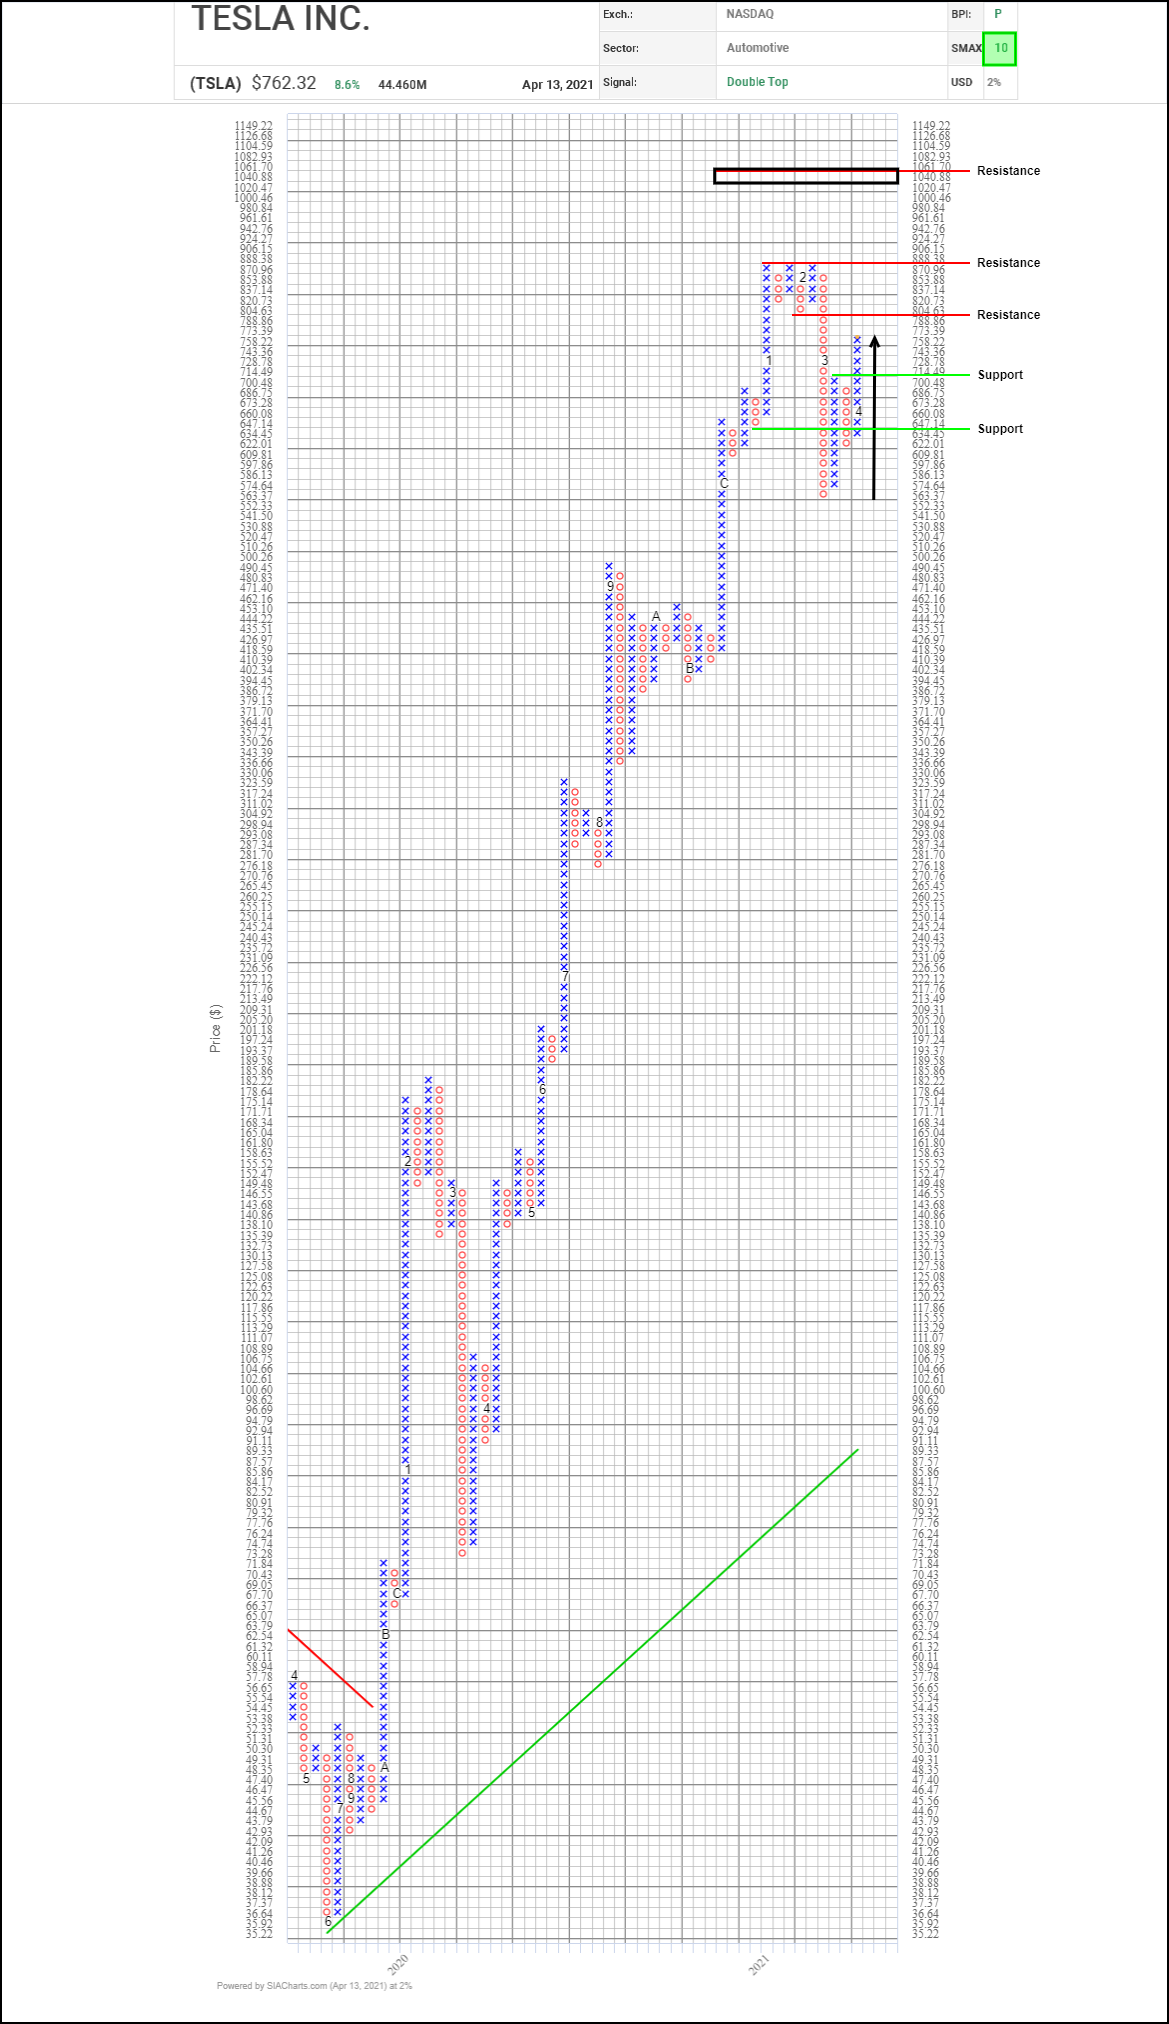
A significant correction in Tesla (TSLA) shares that saw them drop from near $890 toward $550 appears to have run its course with signs emerging that their primary uptrend has resumed. Yesterday, the shares completed a bullish Double Top pattern clearing $700 and then regaining the $750 round number, both signaling the start of a new upswing.
Initial resistance appears near $805, a recent breakdown point, followed by the winter highs near $890. A breakout there to new highs would signal the start of a new advance with next resistance after that possible near the $1,000 round number, then $1,040 based on a horizontal count and $1,060 based on a vertical count. Initial support appears near $700 where a round number and a 3-box reversal converge.
With its bullish SMAX score increasing to a perfect 10, TSLA is exhibiting near-term strength across the asset classes.
Disclaimer: SIACharts Inc. specifically represents that it does not give investment advice or advocate the purchase or sale of any security or investment whatsoever. This information has been prepared without regard to any particular investors investment objectives, financial situation, and needs. None of the information contained in this document constitutes an offer to sell or the solicitation of an offer to buy any security or other investment or an offer to provide investment services of any kind. As such, advisors and their clients should not act on any recommendation (express or implied) or information in this report without obtaining specific advice in relation to their accounts and should not rely on information herein as the primary basis for their investment decisions. Information contained herein is based on data obtained from recognized statistical services, issuer reports or communications, or other sources, believed to be reliable. SIACharts Inc. nor its third party content providers make any representations or warranties or take any responsibility as to the accuracy or completeness of any recommendation or information contained herein and shall not be liable for any errors, inaccuracies or delays in content, or for any actions taken in reliance thereon. Any statements nonfactual in nature constitute only current opinions, which are subject to change without notice.