


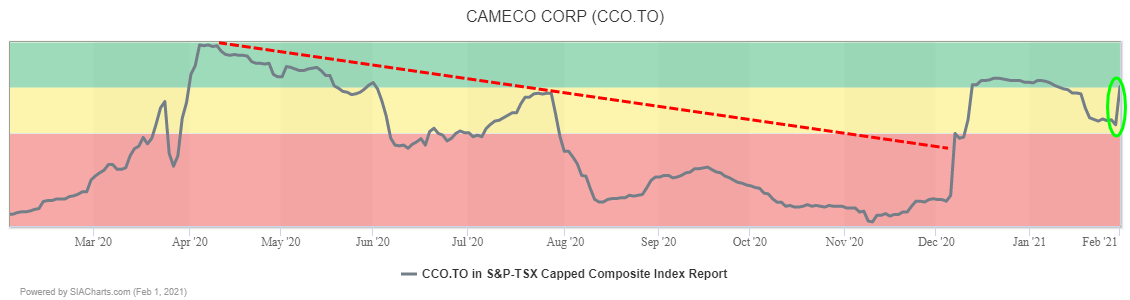
Uranium miner Cameco (CCO.TO) has returned to the Green Favored Zone of the SIA S&P/TSX Composite Index Report after climbing 46 spots yesterday. Cameco also moved up 9 spots in the SIA S&P/TSX 60 Index Report to 6th place.
This eleven-year chart for Cameco (CCO.TO) highlights the importance of its recent rally. The shares spent nearly all of the 2010s in a downward trend, including 5 years between 2016 and 2020 stuck in a trading range between $10.00 and $17.00.
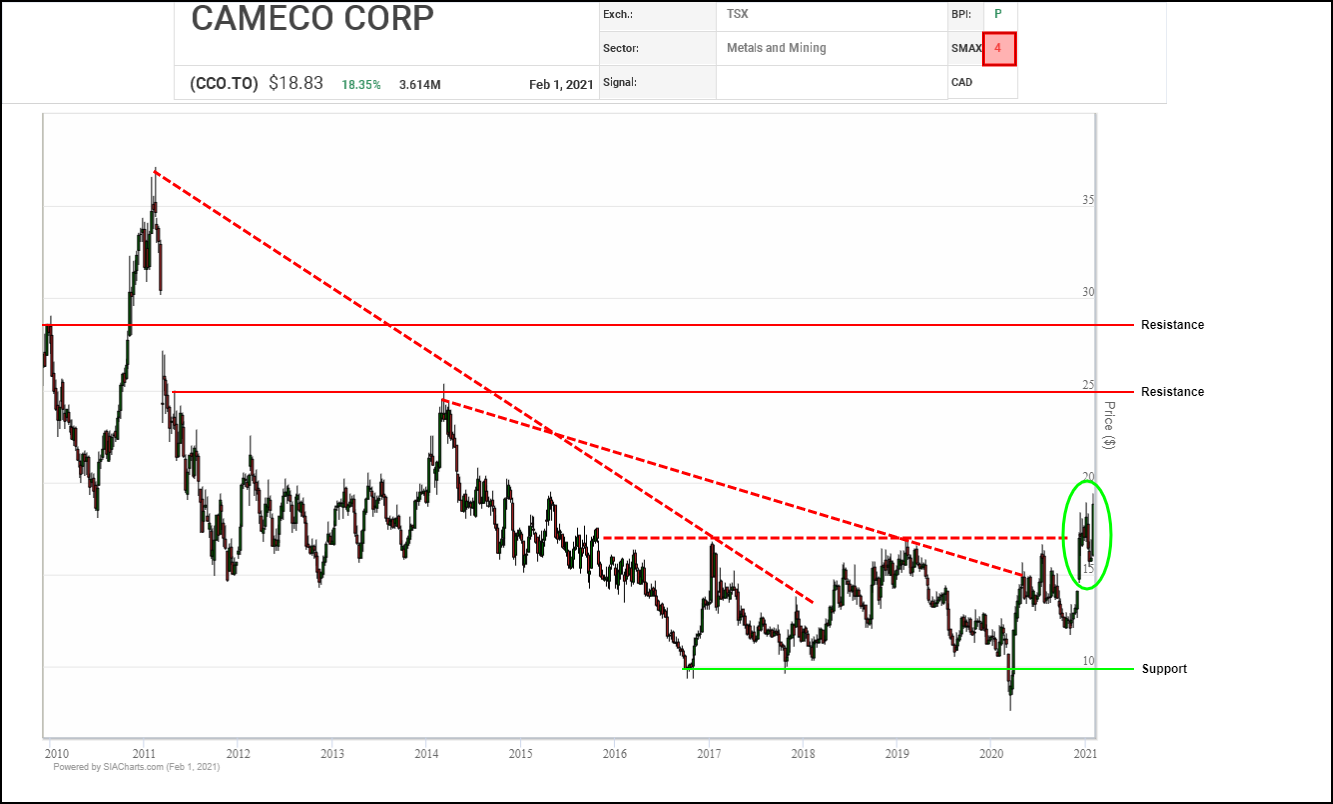
In early 2020, the last of the selling pressure appears to have finally washed out in a brief dip under $10.00. Shortly after that the shares turned back upward and snapped a downtrend line. Late last year, the shares completed their base with a breakout over $17.00 that signaled the start of a new uptrend which continues to this day.
Next potential upside resistance appears near $21.50, $24.00 and $26.00 based on measured moves, plus the $25.00 round number and $28.50 based on a previous high. Initial support appears in place near the $17.00 breakout point.
Back in December, Cameco Corp. (CCO) signaled the start of a new uptrend with a breakout over $17.00 that resolved a multi-year sideways trend to the upside. Following a brief consolidation period, accumulation has resumed with the shares breaking out to a new high yesterday and completing a bullish Double Top pattern to signal the start of a new upleg.
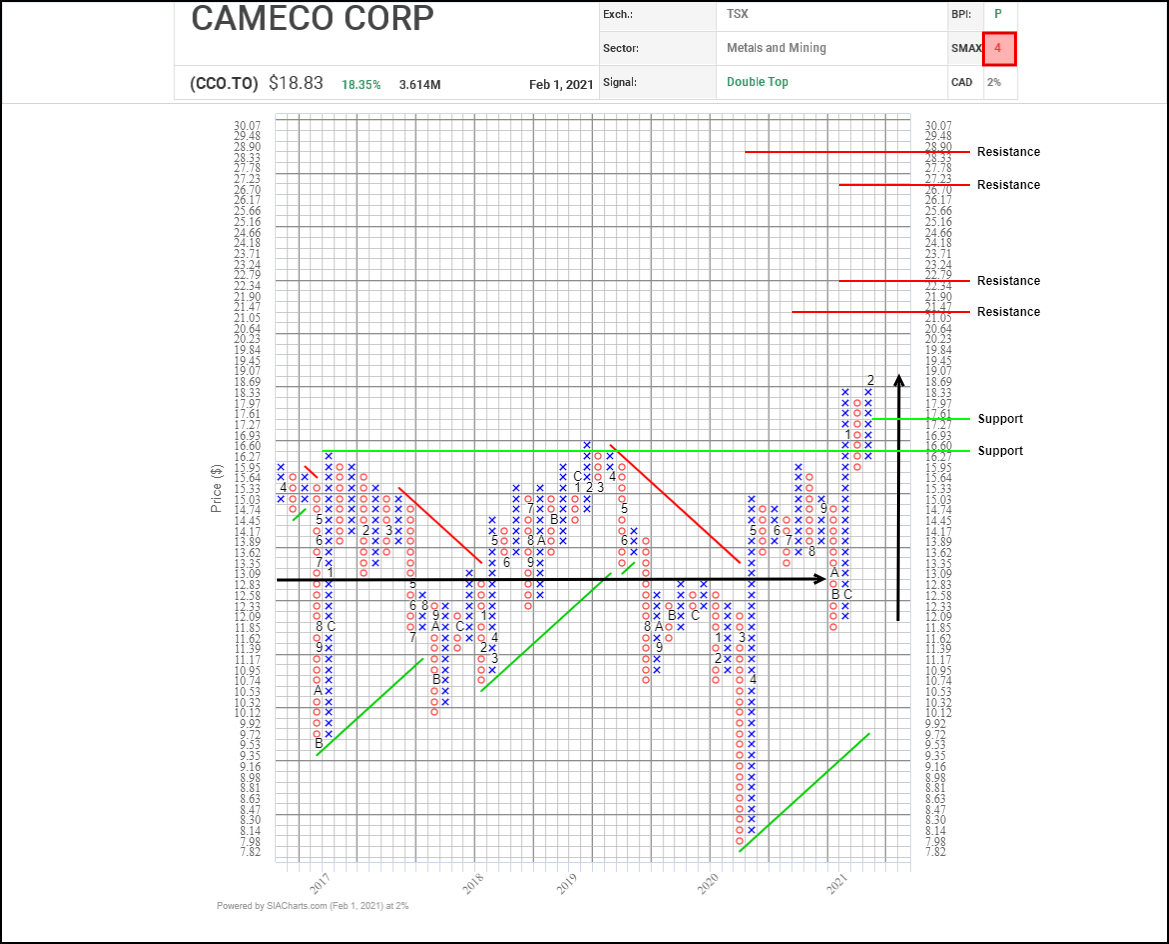
Next potential upside resistance tests on trend appear near $21.50, $22.80, and $27.25 all based on horizontal counts, then $28.90 where two vertical counts converge. Initial support appears near $17.25 based on a 3-box reversal.
Despite its bearish SMAX score improving to 4, CCO.TO is still exhibiting near-term weakness against the asset classes.
Disclaimer: SIACharts Inc. specifically represents that it does not give investment advice or advocate the purchase or sale of any security or investment whatsoever. This information has been prepared without regard to any particular investors investment objectives, financial situation, and needs. None of the information contained in this document constitutes an offer to sell or the solicitation of an offer to buy any security or other investment or an offer to provide investment services of any kind. As such, advisors and their clients should not act on any recommendation (express or implied) or information in this report without obtaining specific advice in relation to their accounts and should not rely on information herein as the primary basis for their investment decisions. Information contained herein is based on data obtained from recognized statistical services, issuer reports or communications, or other sources, believed to be reliable. SIACharts Inc. nor its third party content providers make any representations or warranties or take any responsibility as to the accuracy or completeness of any recommendation or information contained herein and shall not be liable for any errors, inaccuracies or delays in content, or for any actions taken in reliance thereon. Any statements nonfactual in nature constitute only current opinions, which are subject to change without notice.