

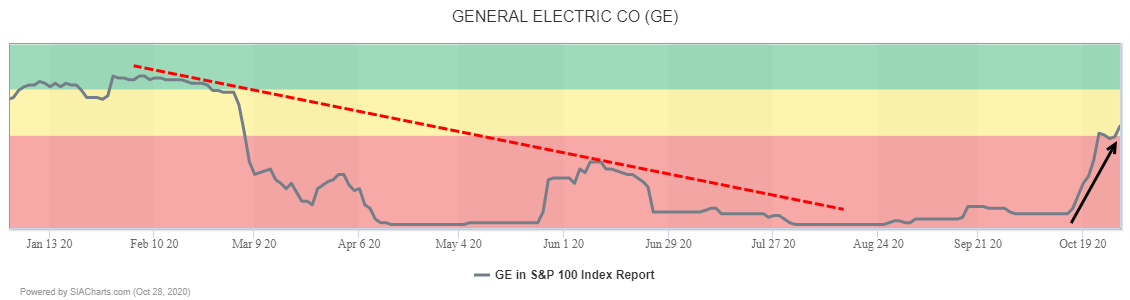
General Electric’s (GE) 4.5% advance on positive earnings made it the only stock in the SIA S&P 100 Index Report to post a gain yesterday. The rally enabled the shares to climb up out of the Red Zone for the first time since March, into the Yellow Neutral Zone. The shares moved up 6 spots yesterday and have climbed 48 spots in the last month.
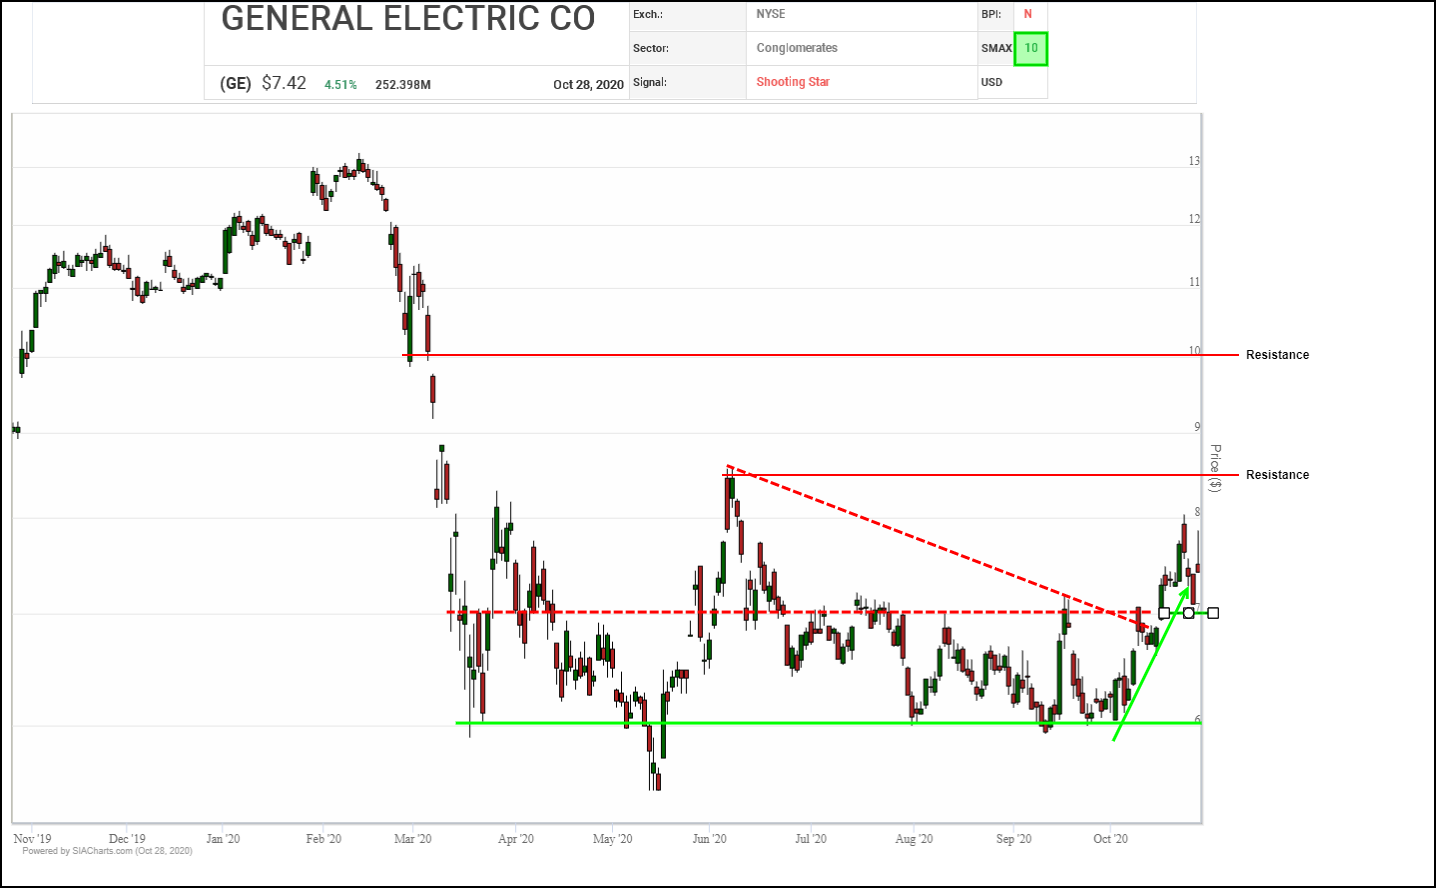
Since March, General Electric (GE) shares have been base building in the $6.00 to $8.50 range. Having spent most of the summer stuck between $6.00 and $7.00, GE has come under renewed accumulation since the start of October with a bullish trend of higher lows emerging. The recent breakout over $7.00 snapped the shares out of a four-month downtrend and signaled the start of a new upswing, which was recently confirmed by a successful retest.
Next potential resistance appears at the previous high near $8.55 where a breakout would confirm the start of a new uptrend, followed by $10.00 where a round number, measured move and old support cluster. Current support appears at the $7.00 breakout point, followed by $6.60.
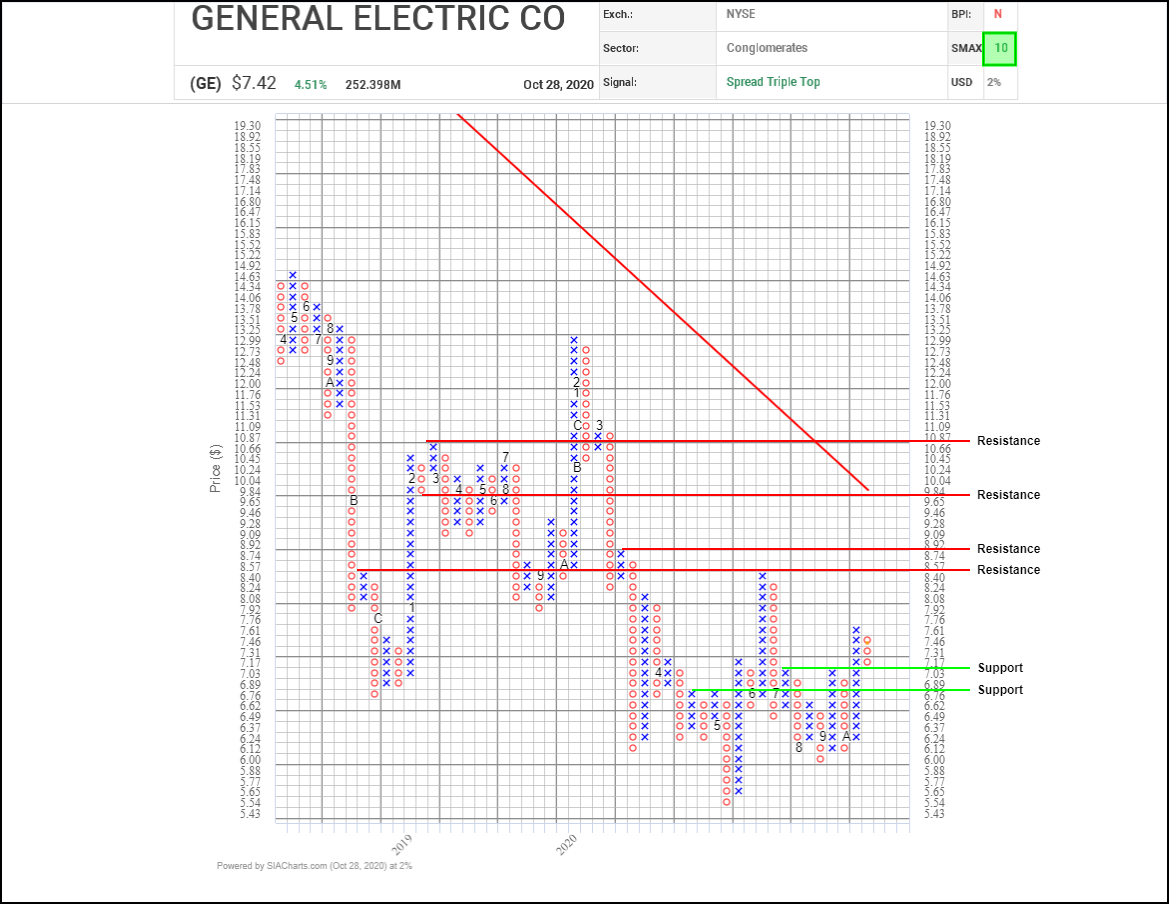
Since bottoming out in May, General Electric (GE) has been building a base for recovery in the $6.00 to $8.50 range. Recently, the shares have started to climb within this zone. Earlier this month, the shares broke out over $7.20, completing a bullish Spread Triple Top pattern, which was recently confirmed by a successful retest of the breakout point as new support.
Initial upside resistance appears in the $8.55 to $8.90 area where several previous column highs/lows converge, followed by the $9.80 to $10.00 area where a downtrend line, round number and prior low cluster. Initial support appears near $7.00 where a round number, the previously mentioned retest and a 3-box reversal cluster.
With a perfect SMAX score of 10, GE is exhibiting near-term strength across the asset classes.
Disclaimer: SIACharts Inc. specifically represents that it does not give investment advice or advocate the purchase or sale of any security or investment whatsoever. This information has been prepared without regard to any particular investors investment objectives, financial situation, and needs. None of the information contained in this document constitutes an offer to sell or the solicitation of an offer to buy any security or other investment or an offer to provide investment services of any kind. As such, advisors and their clients should not act on any recommendation (express or implied) or information in this report without obtaining specific advice in relation to their accounts and should not rely on information herein as the primary basis for their investment decisions. Information contained herein is based on data obtained from recognized statistical services, issuer reports or communications, or other sources, believed to be reliable. SIACharts Inc. nor its third party content providers make any representations or warranties or take any responsibility as to the accuracy or completeness of any recommendation or information contained herein and shall not be liable for any errors, inaccuracies or delays in content, or for any actions taken in reliance thereon. Any statements nonfactual in nature constitute only current opinions, which are subject to change without notice.