

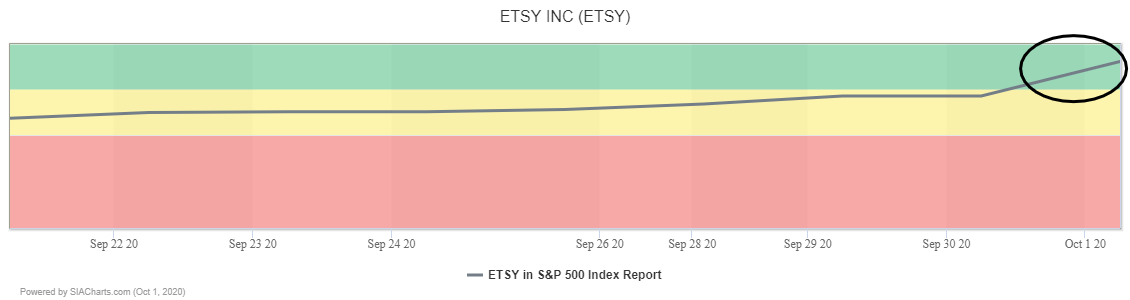
Online art and crafts retailer Etsy (ETSY) recently joined the SIA S&P 500 Index report and yesterday it entered the Green Favored Zone for the first time after jumping 94 spots to 53rd place.
After advancing through the spring and summer, Etsy (ETSY) shares have been trending sideways recently in what looks like a normal consolidation period within a larger uptrend. A correction was contained by uptrend support near the $100.00 round number.
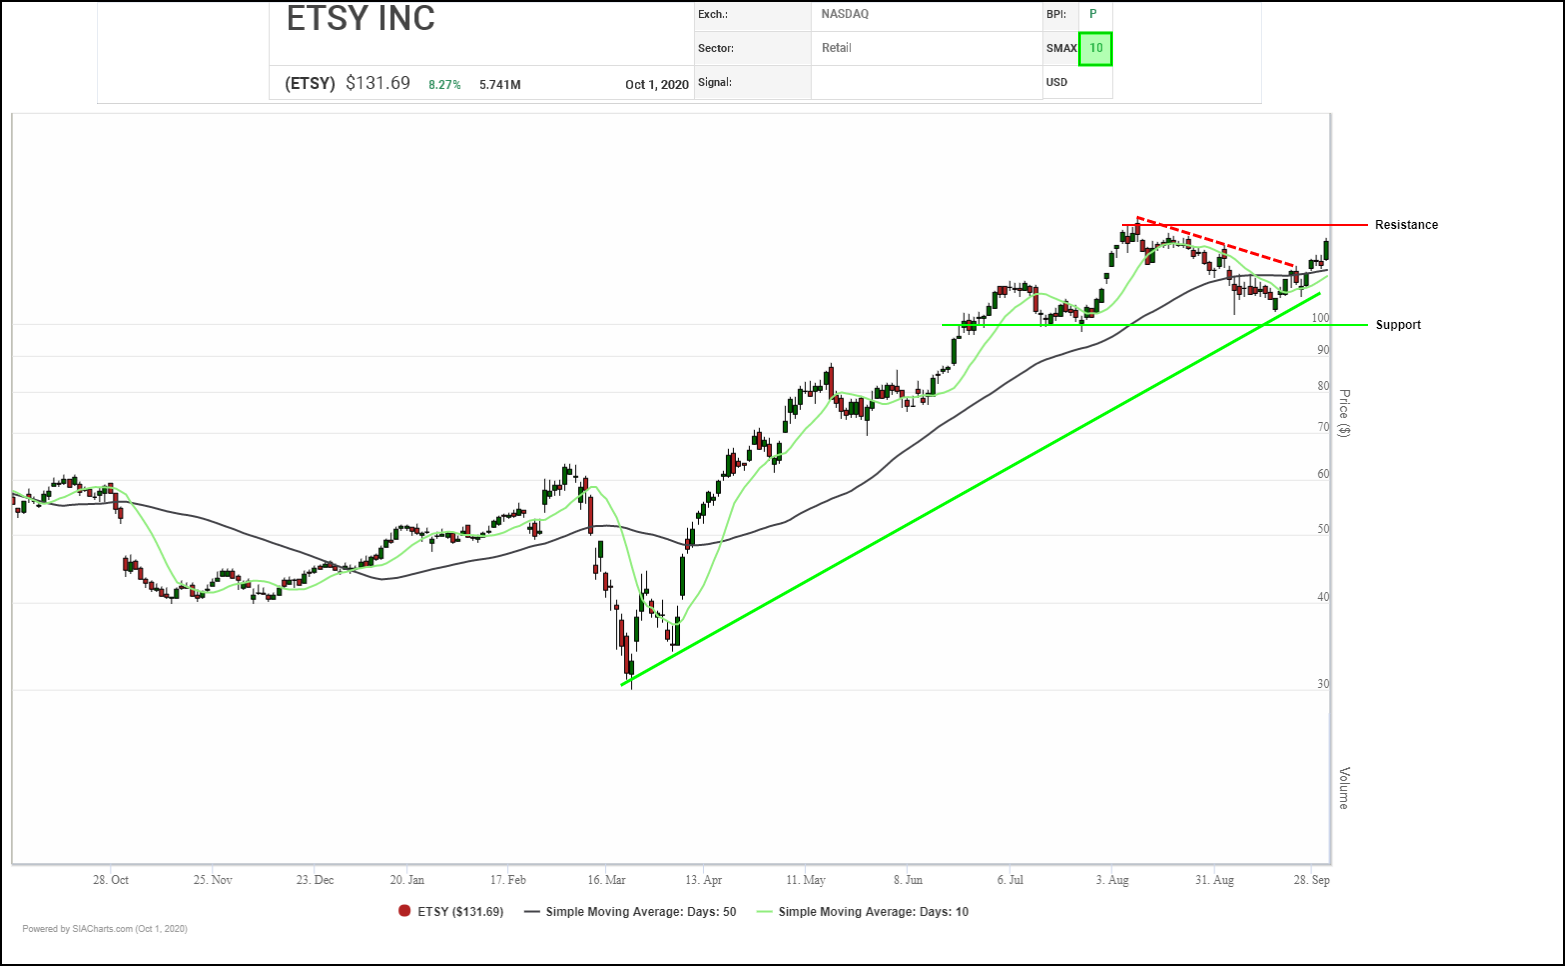
Recently, ETSY has started to swing back upward snapping a downtrend line and climbing back up toward the top of its current $100.00 to $137.50 trading range. Next potential upside resistance tests on a breakout may appear near the $150.00 round number, then near $175.00 based on a measured move. Initial support appears at the 50-day moving average near $120.00.
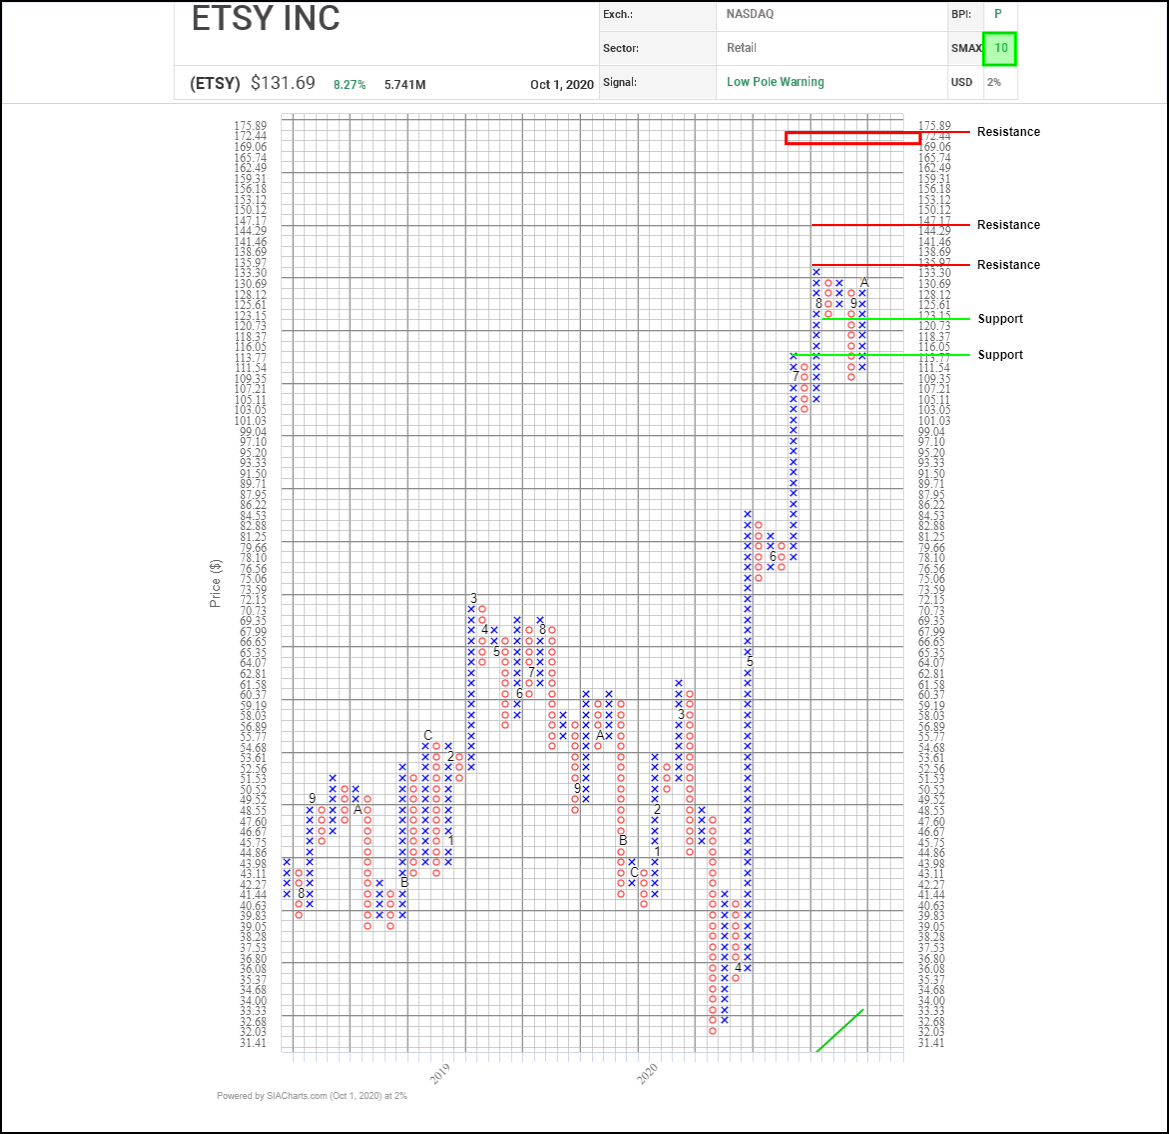
Since bottoming out in March, Etsy (ETSY) shares have been steadily advancing in a step pattern fo rallies followed by consolidation at higher levels. ETSY has been in a consolidation phase since August initial drifting downward, but they have turned back upward recently.
The shares have advanced to retest resistance in the $133.00 to $136.00 area near its previous peak. A breakthrough there to a new high would complete a bullish spread double top pattern and confirm that the primary uptrend has resumed. Should that occur, next potential resistance may appear near $147.20 based on a horizonal count, then the $150.00 round number and then the $172.40 to $175.90 area where two vertical counts converge. On a downturn, initial support may appear near $120.75 based on a 3-box reversal and a previous column low.
With a perfect SMAX score of 10, ETSY is exhibiting near-term strength across the asset classes.
Disclaimer: SIACharts Inc. specifically represents that it does not give investment advice or advocate the purchase or sale of any security or investment whatsoever. This information has been prepared without regard to any particular investors investment objectives, financial situation, and needs. None of the information contained in this document constitutes an offer to sell or the solicitation of an offer to buy any security or other investment or an offer to provide investment services of any kind. As such, advisors and their clients should not act on any recommendation (express or implied) or information in this report without obtaining specific advice in relation to their accounts and should not rely on information herein as the primary basis for their investment decisions. Information contained herein is based on data obtained from recognized statistical services, issuer reports or communications, or other sources, believed to be reliable. SIACharts Inc. nor its third party content providers make any representations or warranties or take any responsibility as to the accuracy or completeness of any recommendation or information contained herein and shall not be liable for any errors, inaccuracies or delays in content, or for any actions taken in reliance thereon. Any statements nonfactual in nature constitute only current opinions, which are subject to change without notice.