
Global equities squeaked out a return in the quarter, but it was a bumpy ride for investors worried about the inverted yield curve and trade war.
by Daniel Phillips, Director, Asset Allocation Strategy, Northern Trust
So, first of all, let me assert my firm belief that the only thing we have to fear is fear itself — nameless, unreasoning, unjustified terror which paralyzes needed efforts to convert retreat into advance." -President Franklin Delano Roosevelt
Such is the most famous sound bite from FDR's 1933 inaugural address, delivered in the middle of the Great Depression. While Roosevelt's mission was to "convert retreat into advance," investors today are more concerned with advance turning into retreat — specifically with respect to the global economy. However, while the order is reversed, the role fear can play is the same. That is, one big risk to a continued economic expansion — and associated stock market gains — is the fear of an economic recession itself. Thus far, this fear has been found less in the consumer sector (where retail sales remain notably robust) than in the business community (where non-defense new capital goods orders — a good proxy for business capital expenditures — have shrunk over the past year). Two developments have been the biggest sources of fear — and resulting decision-making paralysis — for businesses across the U.S.:
The U.S.-China Trade War. Tensions between the U.S. and China have ratcheted up over the past quarter as each side accused the other of not living up to their end of the deal that was reportedly close to being finalized. As a result, companies doing business in China have been focused on rerouting existing supply chains while companies everywhere are holding off on new investment until more clarity is provided on U.S.-China relations and the resulting impact on the U.S. and global economy.
The Inverted Yield Curve. The combination of global growth fears and a slow-to-cut Federal Reserve briefly pushed the 10-year Treasury yield lower than its two-year counterpart, ending the quarter just 0.04% away from the much dreaded inversion. Historically, an inverted yield curve has portended economic recession — and today, while credit markets remain well-behaved, a yield curve inversion risks creating a self-fulfilling prophecy of economic gloom. As such, the markets want more easing. The Fed has stated it will "act as appropriate to sustain the expansion." This may require additional rate cuts (beyond the two already provided) in order to restore a positively sloped yield curve and remove that fear from the minds of executives, consumers and investors alike.
Roosevelt's 1933 inauguration started a 12-year presidency — the longest in U.S. history (future presidents were limited to two elected terms by the 22nd Amendment). The current economic expansion is also the longest in U.S. history (now 10 years and three months old). Its ability to surpass FDR's tenure in office will be dependent on companies' ability to navigate increased trade tensions and the Fed's ability to deal with flat yield curves — and consumers and investors not fearing fear itself.
KEY DEVELOPMENTS
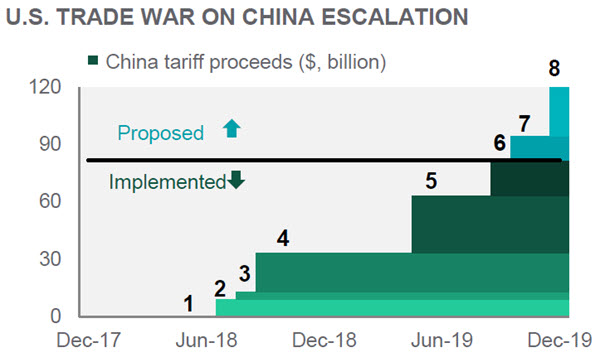
Trade Tensions: Taking Inventory
Keeping up with all the tariffs enacted on China can be hard work. Here's a cheat sheet of all tariff actions thus far and the proceeds accrued to the U.S. government (an annual $82 billion currently): 1) Steel/aluminum; 2) 25% on $34B; 3) 25% on $16B; 4) 10% on $200B; 5) previous $200B increased to 25%; 6) 15% on $125B; 7) first $250B increased to 30% (proposed); 8) 15% on $175B (proposed). Who is actually paying for the trade war? That is not a simple answer. Both sides are incurring costs — as is the global economy.
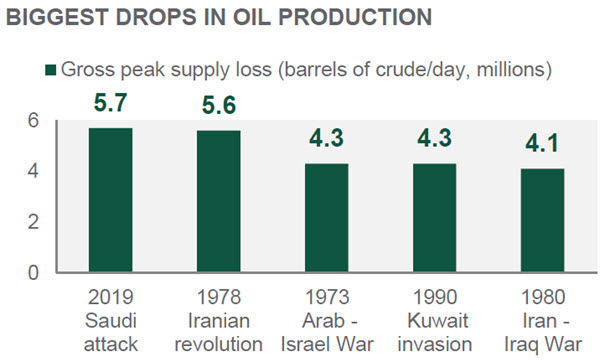
The Oil Crisis That Wasn't
Drone strikes on a major Saudi Arabia production facility temporarily knocked half of the country's, and 5% of the world's, oil production offline. Thirty years ago this event, the largest production disruption in history, would have consumed this entire quarterly review. Today it barely made the cut as a key development. Oil prices spiked by 15% the following day but fell back below pre-attack levels within two weeks. Global stock markets barely flinched highlighting the reduced economic sensitivity to oil supply shocks.
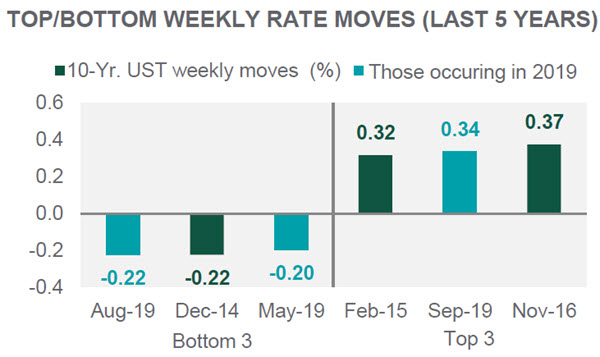
Wild Ride in the Rates Markets
The fixed income markets are supposed to be mostly drama free. But the third quarter was a different story as market participants weighed trade wars and Stuckflation against still-positive U.S. economic growth dynamics. In mid-September, the 10-year Treasury yield rose by 0.34% — second only to the week of Trump's election in terms of upward movement over the past five years. This was on the back of the largest rate reduction over the past five years in August. Since the September spike, the 10-year yield has settled back below 1.70%.
Looking for Yield in All the Wrong Places?
Low and volatile interest rates are prompting many to question the merits of holding fixed income instruments. Fixed income certainly isn't for the income anymore. Across the three biggest economic regions, the local stock market index is providing better yields than the local 10-year government bond – especially the case in Europe and Japan. Other, more income-oriented asset classes such as global real estate and infrastructure have even better yields. That said, fixed income still plays a role in the portfolio for diversification purposes.
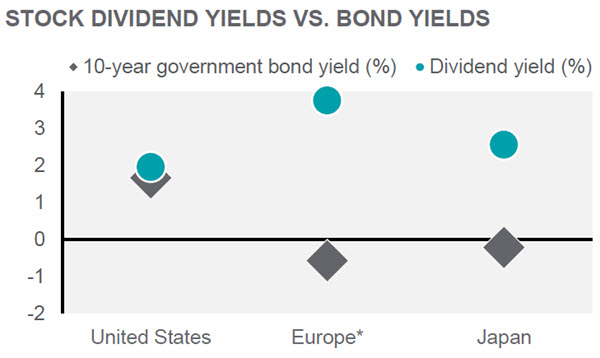
Source: Northern Trust Global Asset Allocation, Eurasia Group, Cornerstone Macro, MSCI, Bloomberg. *Europe 10-year yield is proxied by Germany.
MARKET REVIEW
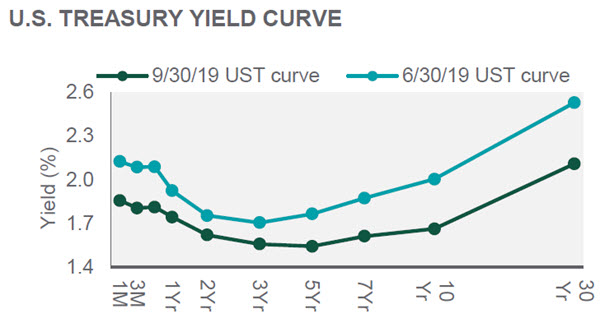
Interest Rates
The yield curve moved lower on both the front and back ends as the Fed played catch up to what was priced into the middle of the curve in terms of rate cuts. All said, the Fed cut rates twice in the third quarter and has indicated that it will "act as appropriate to sustain the expansion." Given global growth pressures — including manufacturing purchasing manager indices now solidly in contraction territory (albeit with services still fairly healthy) — the Fed may need to provide more accommodation in the fourth quarter.
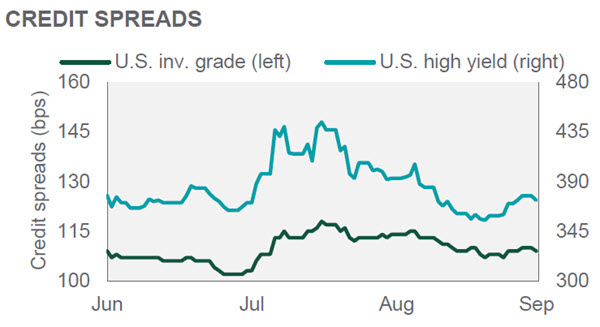
Credit Markets
Credit markets remain well-behaved, with investment grade and high yield spreads mostly unchanged and near decade lows. Despite yield curve inversion concerns, healthy credit markets suggest the economic expansion can continue. Spreads are supported by both fundamental and technical drivers. Fundamentals remain sound, with interest coverage ratios high. At the same time, technicals are supportive with great investor demand for yield and new issuance mostly limited to refinancing to take advantage of low interest rates.
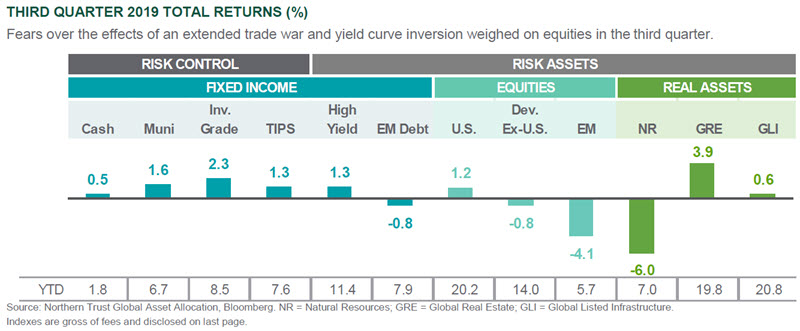
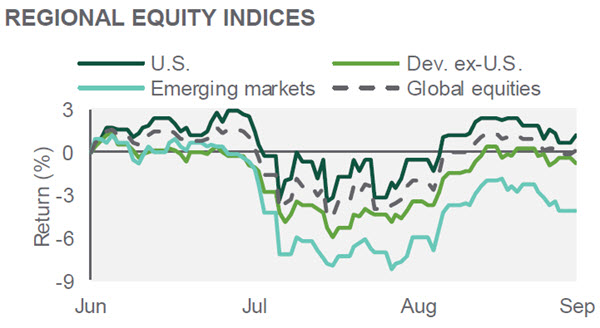
Equities
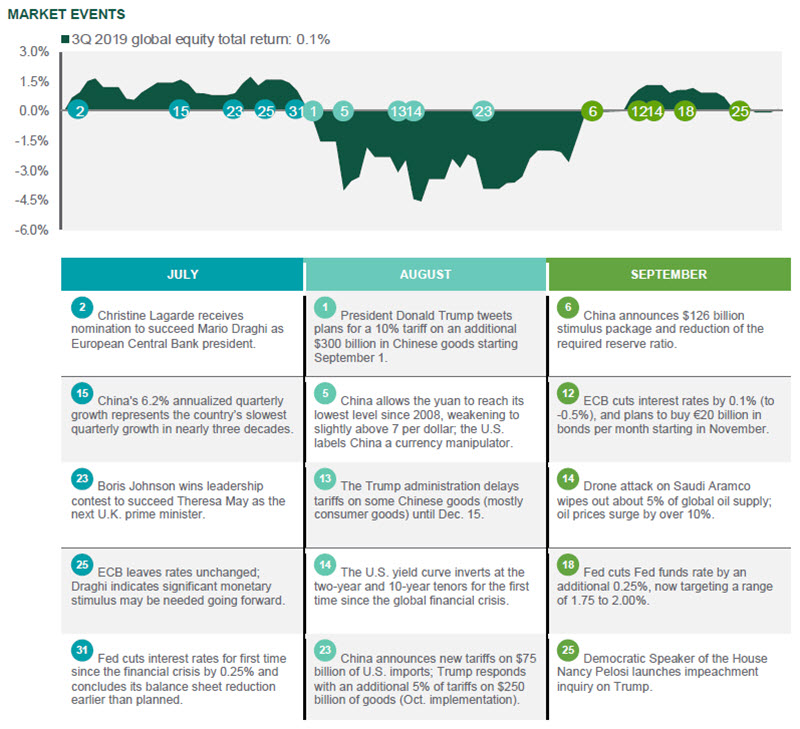
Global equities managed to squeak out a 0.1% gain for the quarter, shrugging off global growth pressures (driven by increased trade tensions) thanks to the interest rate relief valve (with lower rates putting a floor under valuations). U.S. equities once again proved most resilient against trade war concerns, gaining 1.2% for the quarter, while developed ex-U.S. and emerging market equities were both in negative territory. Year-to- date, U.S. equities have far outpaced their international counterparts with a 20.2% gain.
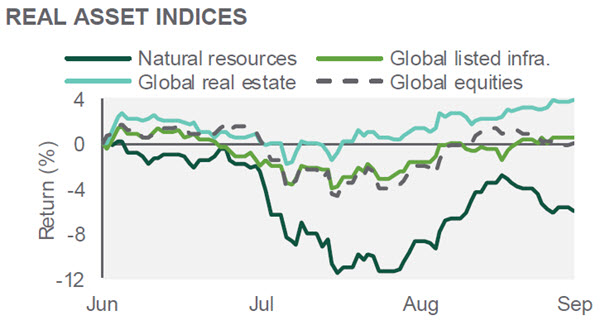
Real Assets
The biggest beneficiaries of the current environment are global real estate and listed infrastructure. Falling interest rates make these "bond proxies" attractive to investors given their higher dividend payouts and leveraged financing models. Of the major asset classes we follow, global real estate was the best performer in the quarter (up 3.9%) while global listed infrastructure represents the best performer year-to-date. Natural resources fell 6.0% as the spike in oil prices proved short-lived.
Source: Northern Trust Global Asset Allocation, Bloomberg. UST = U.S. Treasury. Indexes are gross of fees.
MARKET EVENTS
Indexes used: Bloomberg Barclays (BBC) 1-3 Month UST (Cash); BBC Municipal (Muni); BBC Aggregate (Inv. Grade); BBC TIPS (TIPS); BBC High Yield 2% Capped (High Yield); JP Morgan GBI-EM Global Diversified (Em. Markets Fixed Income); MSCI U.S. Equities IMI (U.S. Equities); MSCI World ex-U.S. IMI (Dev. ex-U.S. Equities); MSCI Emerging Market Equities IMI (Em. Markets Equities); S&P Global Natural Resources (Natural Resources); MSCI ACWI IMI Core Real Estate (Global Real Estate); S&P Global Infrastructure (Global Listed Infrastructure).
IMPORTANT INFORMATION. The information is not intended for distribution or use by any person in any jurisdiction where such distribution would be contrary to local law or regulation. Northern Trust and its affiliates may have positions in and may effect transactions in the markets, contracts and related investments different than described in this information. This information is obtained from sources believed to be reliable, and its accuracy and completeness are not guaranteed. Information does not constitute a recommendation of any investment strategy, is not intended as investment advice and does not take into account all the circumstances of each investor. Opinions and forecasts discussed are those of the author, do not necessarily reflect the views of Northern Trust and are subject to change without notice.
This report is provided for informational purposes only and is not intended to be, and should not be construed as, an offer, solicitation or recommendation with respect to any transaction and should not be treated as legal advice, investment advice or tax advice. Recipients should not rely upon this information as a substitute for obtaining specific legal or tax advice from their own professional legal or tax advisors.
Past performance is no guarantee of future results. Performance returns and the principal value of an investment will fluctuate. Performance returns contained herein are subject to revision by Northern Trust. Comparative indices shown are provided as an indication of the performance of a particular segment of the capital markets and/or alternative strategies in general. Index performance returns do not reflect any management fees, transaction costs or expenses. It is not possible to invest directly in any index.
Copyright © 2019 Northern Trust Corporation. Head Office: 50 South La Salle Street, Chicago, Illinois 60603 U.S.A.