by SIACharts
Stock markets around the world started 2019 off on a tear then paused for six weeks to consolidate their gains. Shaking off a brief March Brexit-related scare, indices in the US and elsewhere have started to climb once again carrying North American indices to within striking distance of their 2018 peaks. In the coming week, we could get a better idea of whether equity markets are ready to start pushing higher once again.
Improving economic numbers out of China (Manufacturing PMI regained 50 to move back into expansion territory), has put a tailwind behind stocks and commodities along with continuing signs of progress in US-China trade talks. In the US, investors have responded favorably to positive Manufacturing PMI and construction spending reports while shrugging off a mixed retail sales report and disappointing ADP payrolls.
Looking ahead to the coming week, US nonfarm payrolls and Canada jobs are due on Friday. Investors will likely be looking for a rebound in nonfarm payrolls from last month’s shockingly low 20K (the street is expecting 180K this month), and for signs that the US is moving past the government shutdown distortions. China trade numbers are due on the weekend which could influence trading in commodities, Asia Pacific and resource stocks heading into next week.
Brexit remains an outside risk factor as the April 10th deadline to leave with no deal or seek a long extension approaches. Brinksmanship negotiations are underway and there remains a risk someone could miscalculate. On the other hand, the Dax has started to rebound and capital has started to move back out of havens like Gold and US bonds indicating that the worst case scenarios are starting to be discounted.
In this issue of Equity Leaders Weekly, we take a look how the prospects for an improving economy in China has not only attracted renewed interest in Chinese stocks, but also resource stocks based on the prospects for improving Chinese resource demand boosting commodity prices.
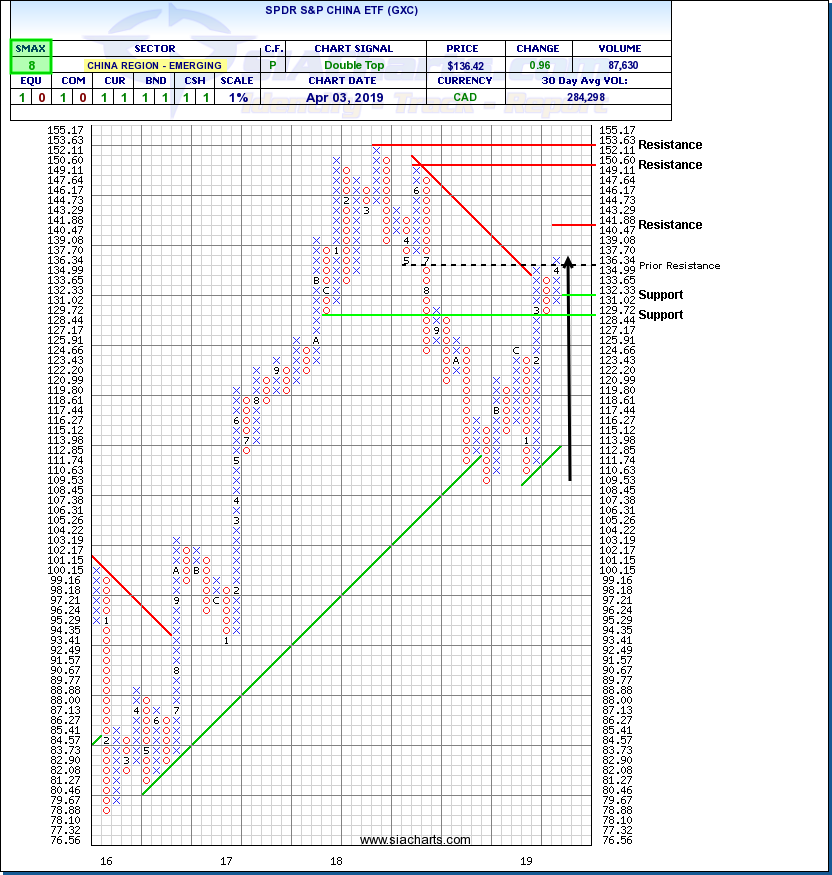
SPDR S&P China ETF (GXC)
Chinese stocks spent most of 2018 in retreat as the negative impact of US tariffs took its toll on China’s economy and the risk of a full-blown trade war negatively impacted investor sentiment toward China. Between March and October (interestingly China bottomed out before the US last fall), the SPDR S&P China ETF (GXC) plunged 28.1% compared with the 19.6% S&P 500 decline.
Following a successful retest of the 2018 low in January, Chinese stocks and GXC have been on the rebound. Progress in US-China trade talks, the Chinese government taking steps to stimulate its economy and recent signs of improvement in Chinese economic figures have improved sentiment toward China-sensitive markets dramatically so far in 2019.
Following an initial rally, GXC consolidated at a higher level, as is normal, but now appears to be ready to resume its uptrend. This week, GXC broke out over $136.35 to complete a bullish Double Top pattern and signal the start of a new upleg. A horizontal count suggests initial resistance may appear near $141.88 followed by previous column highs near $150.60 and $153.63. Initial support appears near $131.02 based on a 3-box reversal.
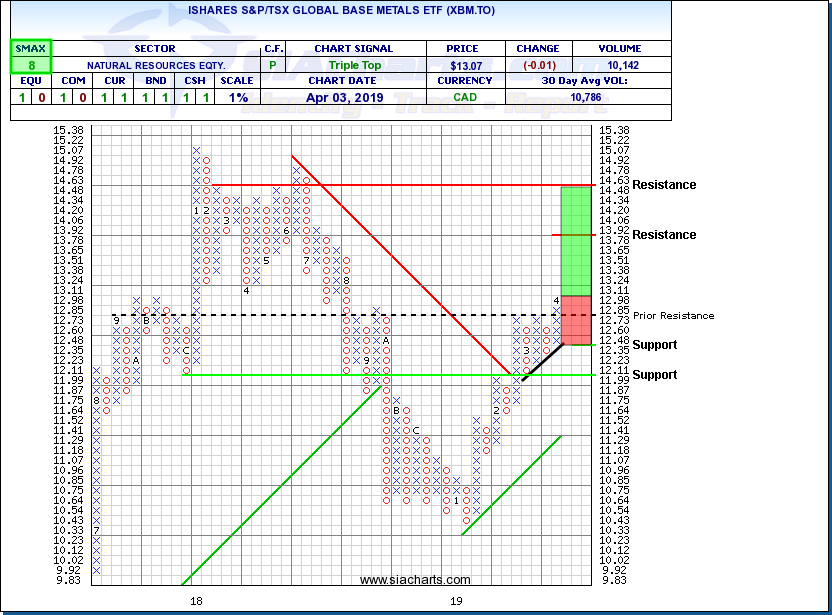
iShares S&P/TSX Global Base Metals ETF (XBM.TO)
Indications that China’s economy not-only may avoid the worst-case outcome of a trade war driven recession, but is starting to show signs of recovery has had a positive impact on commodity prices as China remains a big driver of resource demand. Copper and other base metals in particular, have benefitted from an improving Chinese demand outlook. (Crude oil has also benefitted from a resurgent China but in that case the story is just as much about supply side reductions whether from Saudi Arabia/Russia/Alberta supply cuts or Iran/Venezuela sanctions).
Improving base metal prices have sparked renewed interest in base metal mining stocks. The iShares S&P/TSX Global Base Metals ETF (XBM.TO) has been climbing since January and gains appear to be accelerating.
Earlier this week, XBM.TO broke out over $12.85, completing a bullish Triple Top pattern and signalling the start of a new upleg. A horizontal count suggests initial resistance possible near $13.92 followed by previous column highs near $14.63. Initial support moves up toward $2.35 based on a 3-box reversal.