


by Michael Gayed, CFA, Portfolio Manager, Pension Partners
“All truth passes through three stages. First, it is ridiculed. Second, it is violently opposed. Third, it is accepted as being self-evident.” – Arthur Schopenhauer
I’m sorry, but I call BS on the way the stock market’s rally has held over the last several weeks.
I’m not saying that based on some emotional response to the move or based on some hidden motive.
The reality is that multiple indicators are flashing warning signs that I believe are being ignored by short-termism and overly excited market prognosticators
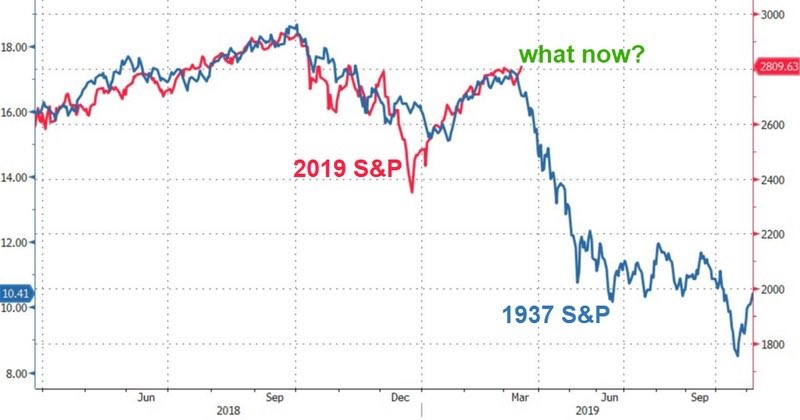
It is incredibly important to recognize that big moves cluster in both directions. I came across this fun little chart on Twitter.
Not implying it plays out the same way, but to think that stocks can’t retest the lows of last year (or go lower) simply because of how violent the move back up has been going against plenty of historical examples that say quite the opposite.
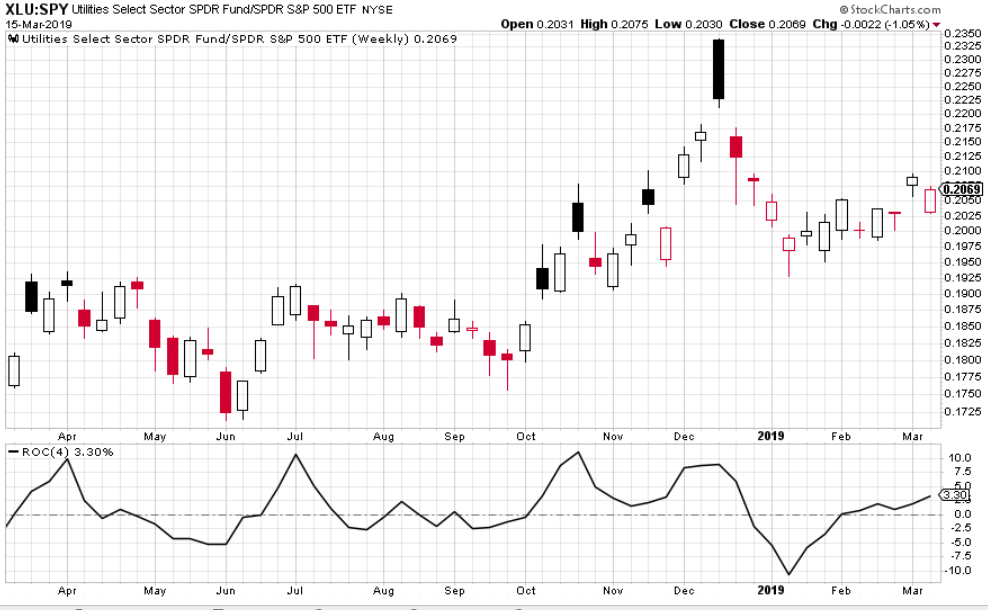
Objectively, the 3, 4, 5, and 6-week rate of change of Utilities relative to the S&P 500 remains positive.
For those familiar with the 2014 Dow Award winning paper “An Intermarket Approach to Beta Rotation,” Utilities are a key sector to pay attention to as their strength tends to precede corrections and volatility spikes.
Utilities into the market’s advance of the last several weeks have held. This is a warning more often than not that gains may indeed be bogus.
High beta stocks relative low beta have fallen and can’t get back up. The ratio of high beta to low volatility is rolling over as stocks indices “break out.”
With active QE, the bull market was led by low volatility dividend-paying stocks because of the hunt for yield insanity that the Fed lulled investors into.
Rates are not at zero in the US, and to see low-volatility actually firming up in the last few weeks of the market’s push makes things suspect.
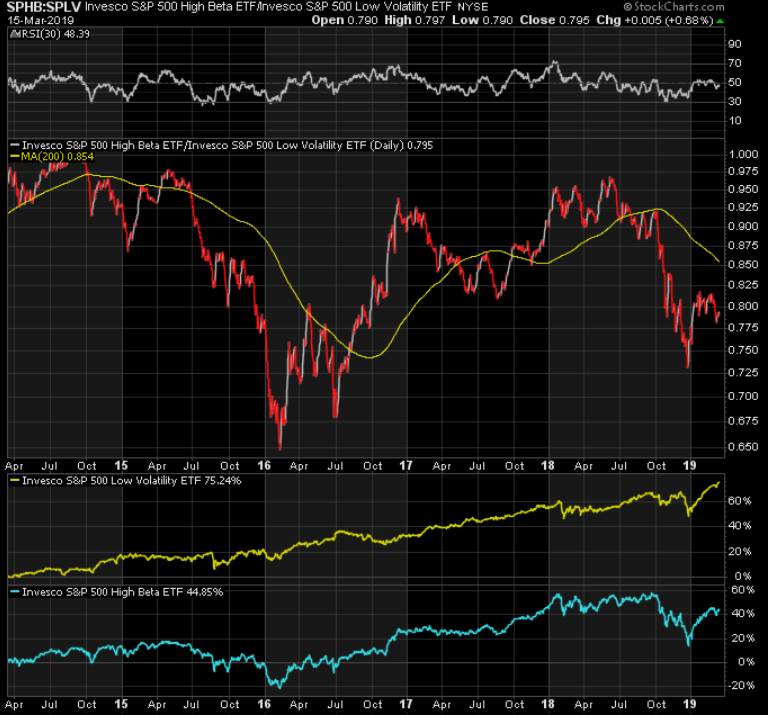
No – it doesn’t look right from a quant perspective and doesn’t feel right from a subjective perspective. And with Treasuries on the shorter end of the curve getting more inverted and kinked, something is bothering the market here sub-consciously.
Whether the market will react remains to be seen. But given this is a business about managing risk, it’s worth considering that the greatest risk may be thinking the worst is over. I believe the odds are favoring another major decline, and soon. And if that doesn’t happen I’d rather be wrong and early than right and too late.
This writing is for informational purposes only and does not constitute an offer to sell, a solicitation to buy, or a recommendation regarding any securities transaction, or as an offer to provide advisory or other services by Pension Partners, LLC in any jurisdiction in which such offer, solicitation, purchase or sale would be unlawful under the securities laws of such jurisdiction. The information contained in this writing should not be construed as financial or investment advice on any subject matter. Pension Partners, LLC expressly disclaims all liability in respect to actions taken based on any or all of the information on this writing.
Copyright © Pension Partners