
In the famous book, Strange Case of Dr. Jekyll and Mr. Hyde, Dr. Jekyll and Mr. Hyde were one human being with a split personality. Dr. Jekyll healed people and Mr. Hyde murdered them. This economic environment and the U.S. stock market have the same kind of split personality. The economic environment has been healing people with jobs, consumer confidence and a bright demographic future. At the same time, in the second half of 2018, the Mr. Hyde stock market took investors out back to a slaughter, knocking a swift 18-20% off major indexes and punishing over-priced glam tech stocks even more.
As we enter 2019, investors are afraid that the loss of confidence created by the Mr. Hyde stock market could spread to a big economic slowdown or lead to an economic contraction (aka recession). In this quarterly rundown, we will discuss the economic environment, as well as the psychology and fundamentals of the stock market. Lastly, we will be reminded of how unpredictable the stock market is in the short run and why we lean so heavily on our eight criteria for common stock selection in ownership time frames of five to ten years.
Economic growth is driven by a variety of factors and what we like to do is ask a question. What has the stock market decline done to the ingredients of economic growth for the Dr. Jekyll economy?
Interest Rates
The stock market decline has triggered intense fear of an economic slowdown and ten-year Treasury Bond rates have fallen from 3.26% to 2.67% as of January 2, 2019. The rise in interest rates had caused 30-year fixed mortgages to rise from 4% to 5% in the last year and it may take a few months for the recent decline to filter into home purchase decisions. Once we reach the spring selling season, it is very possible that mortgage rates will drop to as low as 4.4%. If history is any guide, that is a bargain and should stimulate housing activity. Dr. Jekyll is kind here.
Oil and Commodity Input prices
Oil prices got crushed in the second half of 2018 and most states in the U.S. are on the way to sub-$2.00 per gallon prices for unleaded gas. This is a huge stimulus to average families. Lumber prices have fallen markedly in the last year and so has the price of copper. The good Dr. Jekyll loves the reduction in commodity prices as they are a tax on consumers.
Household Balance Sheets
As the chart below shows, U.S. households are using the smallest percentage of their gross income to service their mortgage debt in the last 39 years. This is a platform for future economic growth as it gravitates to the 5.5% historical average. More positive news from the good doctor.
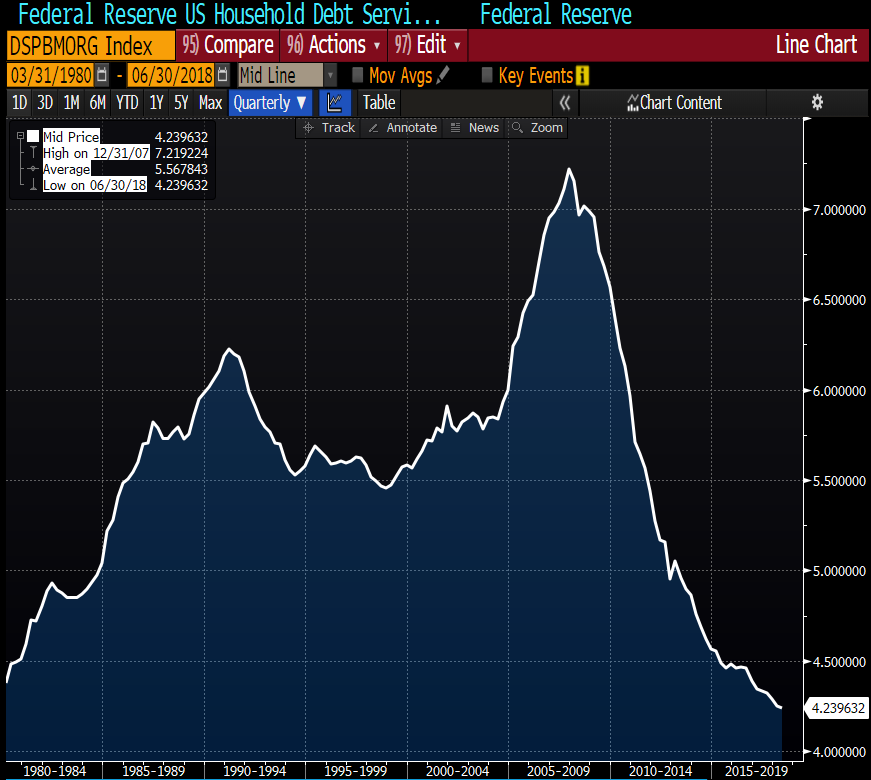
Source: Bloomberg. Data for the time period 3/31/1980 – 6/30/2018.
Demographics of the Next Ten Years
There will be a massive increase in the number of 35-44-year-old Americans:
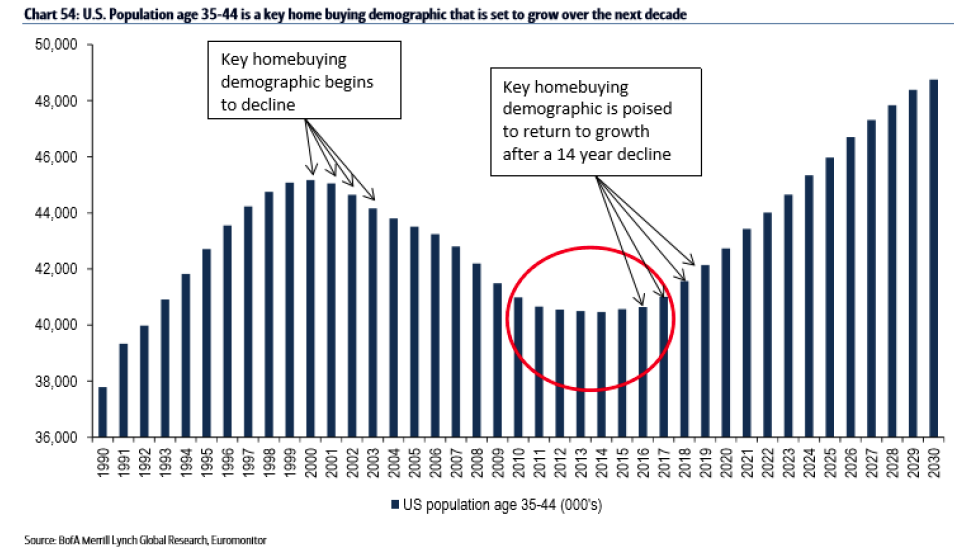
Source: BofA Merrill Lynch Global Research Data for the time period 1/1/1990-12/31/2030. Forecasted data is projected.
This should cause an automatic expansion in household formation and spending/borrowing based on the chart below:
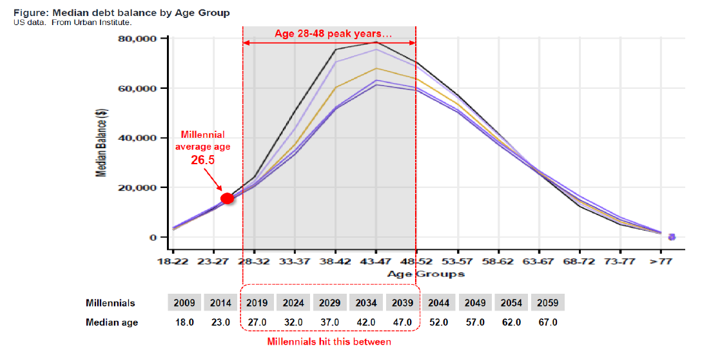
Source: Fundstrat. Data for the time period 6/30/1995 – 12/31/2018.
Housing Creation and Replacement
Freddie Mac estimates that it would take years to ramp up home building to replace the 300,000 homes which become unlivable, provide 100,000 new second homes, provide a decent or normal resale market with 120,000 homes for sale and to produce 1.1 million new homes to meet the needs of over 80 million people reaching peak home ownership age in the next ten years. However, the pace of building in the last five years leaves us 2.5 million homes shy of normal, so we need to build at a pace last seen in the late 1970s and early 1980s to meet the demand. The labor needed for building and the scale required to meet this economic need puts the publicly-traded builders in their most powerful position in U.S. history. Their moat is large and growing. Housing could be Dr. Jekyll’s strongest sector of the economy the next ten years.
Expensive Coastal Cities
We believe that money goes where it gets treated the best. We think there will be a drag on the big coastal cities and the part they play in the U.S. economy. First, an extended bear market in tech stocks could hurt the wealth of the expensive coastal cities. Second, when the largest population group ages and recognizes that they can do more for their family by moving to a less expensive area of the country, economic activity could spread across the country. Steve Case, former CEO of AOL, calls this “The Rise of the Rest” in his recent book, The Third Wave. Mr. Hyde could get in Dr. Jekyll’s way here.
The Psychology and Fundamentals of the Mr. Hyde Stock Market
Sentiment Surveys
In the last four weeks, individual investors have been as bearish as they were at most bear market bottoms, averaging 1.5 bears for every bullish voter. Professionals finally buckled recently, with the number of bears exceeding bulls and could join them soon if markets don’t turn around. It is safe to say that most investors are fearful. We aren’t market timers, but we like buying when other investors are scared. Mr. Hyde has scared market participants.
Growth Versus Value
The chart below shows that this is likely to be hog heaven for value managers (on a relative basis) as markets revert to historical means:
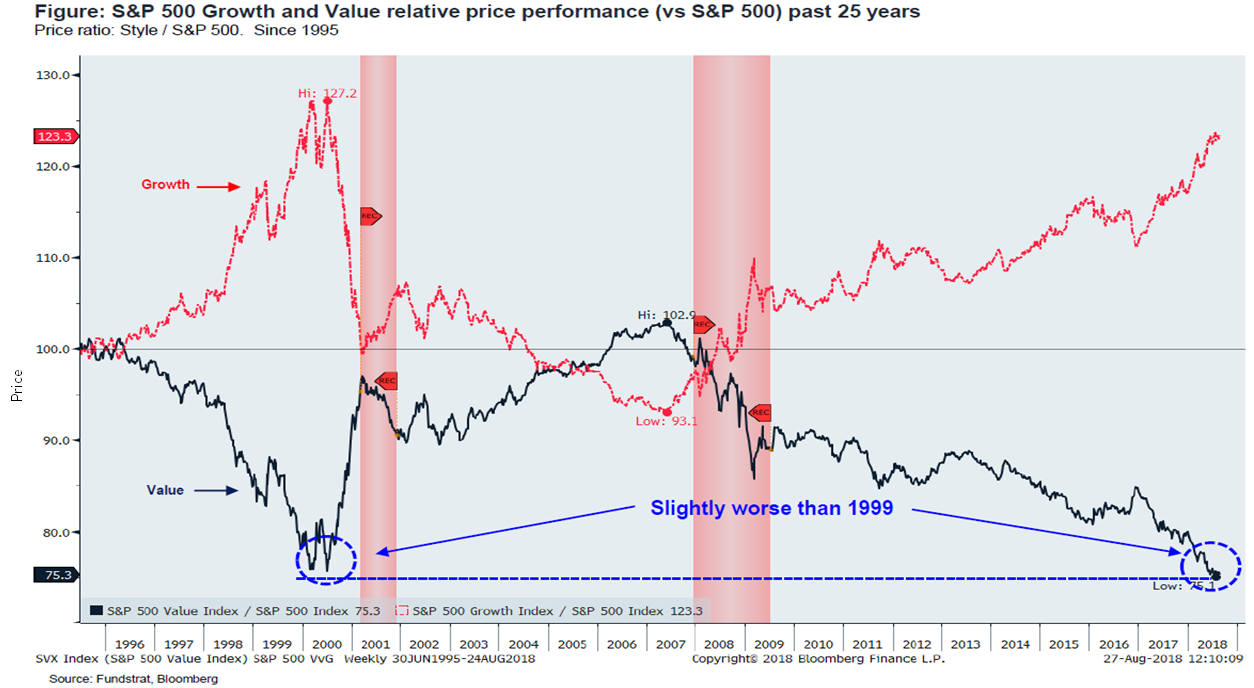
Source: Fundstrat. Data for the time period 1/1/1996 – 8/29/2018.
Mr. Hyde doesn’t care about this, but we do.
S&P 500 Index Breakdown
The S&P 500 Index is heavily over-weighted in the most expensive stocks and the reckoning looks like it is well on its way. Mr. Hyde has already begun to have his way with this problem, but it is early in the process.
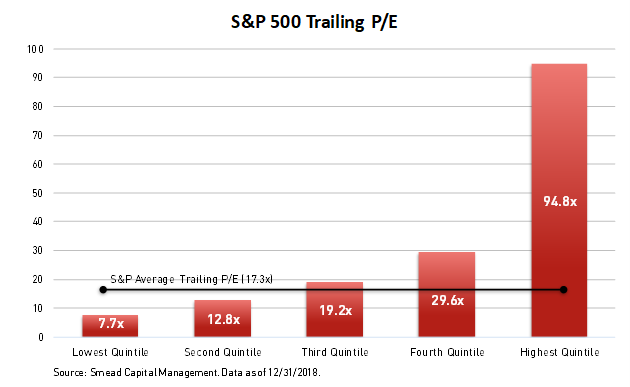
Source: FactSet. Calculations are made using GAAP (generally accepted accounting principles) and each quintile is calculated on a weighted average basis. The S&P Average Trailing P/E Ratio is based on public sources provided by Bloomberg.
E-commerce Bubble
The e-commerce bubble looks as big as all the bubbles of the last 40 years. Mr. Hyde loves his potential destruction capability coming out of a bubble.
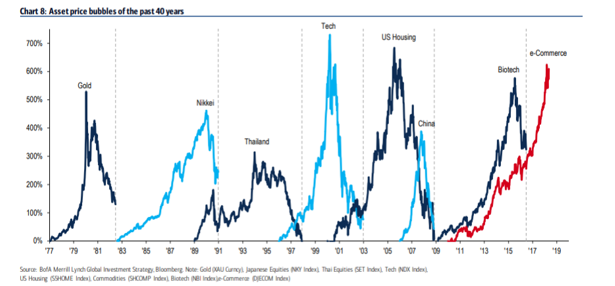
Source: BofA Merrill Lynch. Data for the time period 1/1/1977 – 12/31/2018.
Money losing initial public offerings (IPOs) and percentage of stocks losing money
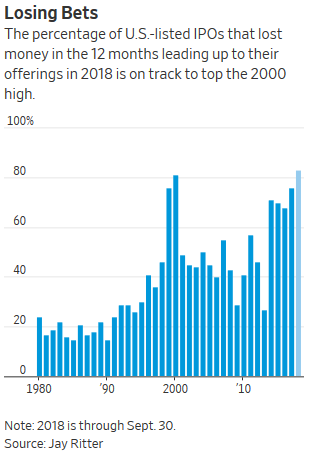
Source: The Wall Street Journal
Risks taken on tech stocks looked as dumb in the last 12 months as they have ever looked to us. Mr. Hyde loves to prey on ridiculously over-priced common stocks.
Unpredictability of Short-Term Results
Why we work in long duration
The more time you spend in the market, the more the remote the possibility of losing money becomes.
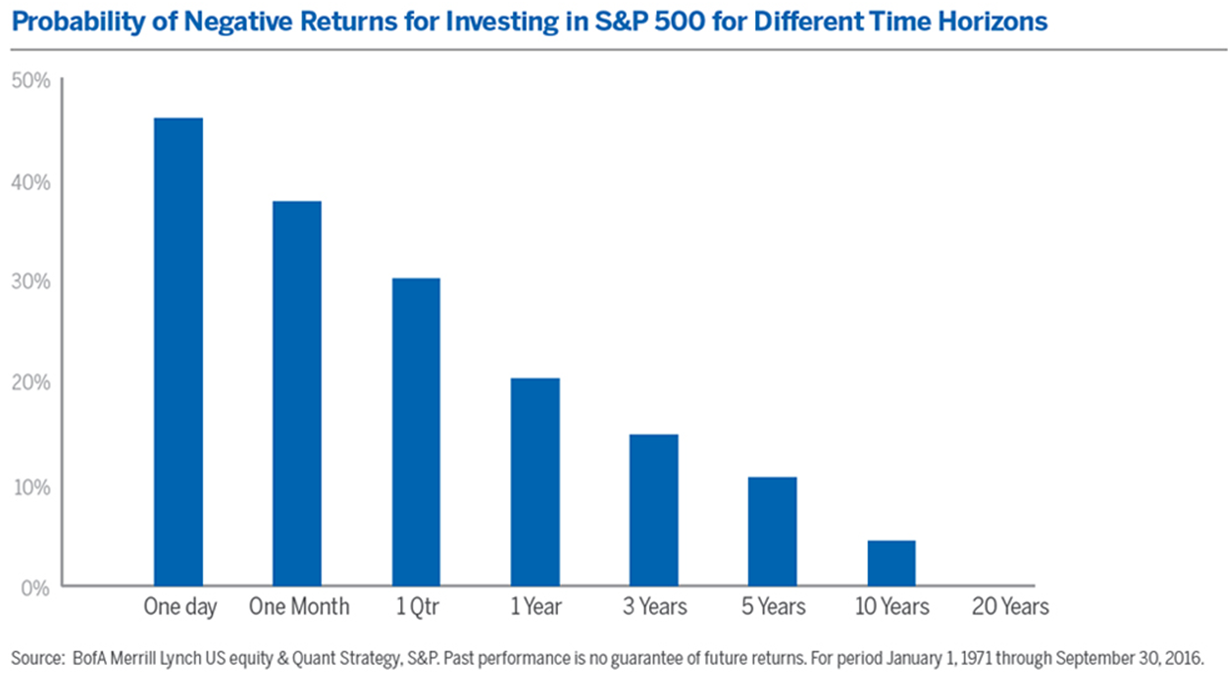
Source: BofA Merrill Lynch. Data for the time period 1/1/1971 – 9/30/2016.
History shows that it pays to stay in your chair and not let Mr. Hyde scare you away.
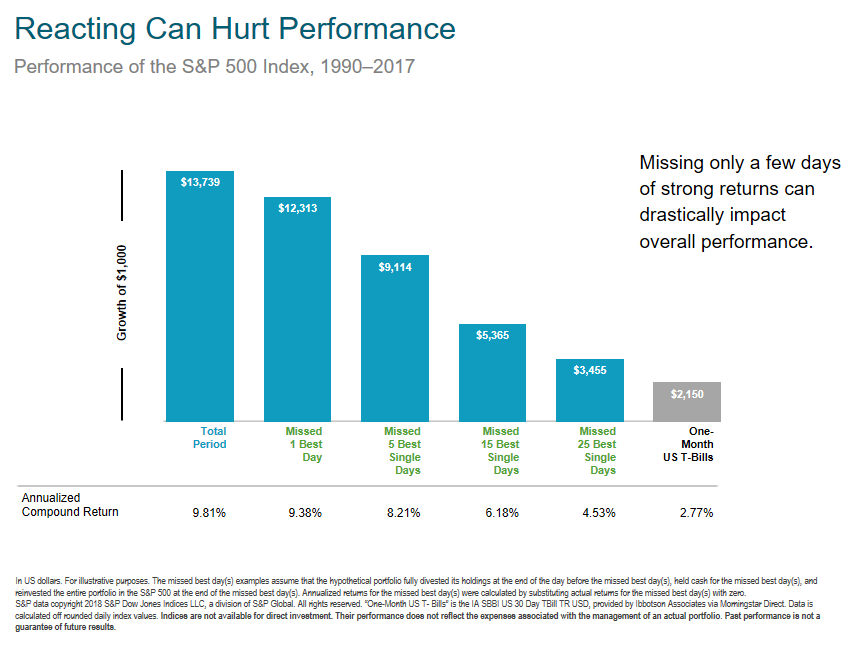
Source: S&P 500. Data for the time period 10/1/1989 – 12/31/2016.
Mr. Hyde hopes people speculate in short time frames and don’t work in the long time frames that have a tendency to provide success.
Why we lean on our eight criteria for common stock selection
Our eight criteria for common stock investing leads us to lightly capital-intensive businesses with high and consistent profitability/free cash-flow generation. They have moats which defend them, shareholder friendliness which guides them and balance sheets of strength providing a firm foundation. We seek strong insider ownership and prefer to make purchases when insiders are buying themselves. We followed Jamie Dimon into JPMorgan (JPM) in the summer of 2012 and John Malone into Discovery Inc. (DISCA) in late 2017 when they bought millions of dollars of their own shares.
When ill winds blow temporarily, the predetermined aspects of our companies reduce our risk and lead us across the worst market valleys. An investor who bought into our strategy in early 2008 has earned very respectable returns despite sitting through the worst decline of the last 96 years. Mr. Hyde can pester us but has not had long-term influence on our discipline.
What does our view of Dr. Jekyll and Mr. Hyde do to our portfolio holdings and where do we see the best opportunities?
We are avoiding glam tech until those companies become a swear word and insiders start backing up the truck to buy their own shares. We think these tech powerhouses could be subject to sizable regulation and could possibly be broken up into multiple companies as the political winds change. Remember how long Microsoft, Intel and Cisco stayed in the doghouse after the tech bubble broke in 2000-2003? It took Microsoft 15 years to get back to its 2000 high and they were the best among the triumvirate mentioned.
We like healthcare/pharma via Amgen (AMGN) and Merck (MRK). Once investors get over the idea that medicines are at the heart of healthcare expenses (they aren’t) and folks see the incredible work and lives being saved, we could see investors embrace these stocks. They look relatively untouchable by Mr. Hyde.
Our strategy will continue to take the short-term punishment from Mr. Hyde to bet that Freddie Mac is right about home building over the next ten years. NVR (NVR) and Home Depot (HD) are our direct favorites. We believe American Express (AXP) and the big U.S. banks like JPMorgan (JPM) and Bank of America (BAC) will be indirect beneficiaries as the largest population groups increase monetary velocity and transactions. Dr. Jekyll’s economy is a big helper here.
Lastly, our eight criteria for stock selection guides us to media and consumer discretionary companies which cater to 35-44-year-old families. Discovery Inc. (DISCA), Disney (DIS) and Target (TGT) are good examples of our optimism. The cheapness of these stocks could keep Mr. Hyde away and Dr. Jekyll’s economy could put money in their pockets. Overall, our portfolio started the year at a 12-month forward price-to-earnings ratio as low as at the beginning of 2011 and 2012.
We want to thank our loyal investors for joining us in our long-duration discipline and want you to feel comfortable even when we run into nasty stock market declines and assorted split-personality circumstances.
The recent growth in the stock market has helped to produce short-term returns for some asset classes that are not typical and may not continue in the future. The price-earnings ratio (P/E Ratio) measures a company’s current share price relative to its per-share earnings. Beta tests are a trial of machinery, software, or other products, in the final stages of its development, carried out by a party unconnected with its development. A stalwart is a loyal, reliable, and hardworking supporter or participant in an organization or team. Bear market is a market in which prices are falling, encouraging selling. Alpha is a measure of performance on a risk-adjusted basis. Bull run is a financial market of a group of securities in which prices are rising or are expected to rise.
The information contained herein represents the opinion of Smead Capital Management and is not intended to be a forecast of future events, a guarantee of future results, nor investment advice.
Smead Capital Management, Inc.(“SCM”) is an SEC registered investment adviser with its principal place of business in the State of Washington. SCM and its representatives are in compliance with the current registration and notice filing requirements imposed upon registered investment advisers by those states in which SCM maintains clients. SCM may only transact business in those states in which it is notice filed or qualifies for an exemption or exclusion from notice filing requirements. Registered investment adviser does not imply a certain level of skill or training.
This newsletter contains general information that is not suitable for everyone. Any information contained in this newsletter represents SCM’s opinions, and should not be construed as personalized or individualized investment advice. Past performance is no guarantee of future results. There is no guarantee that the views and opinions expressed in this newsletter will come to pass. Investing in the stock market involves gains and losses and may not be suitable for all investors. Information presented herein is subject to change without notice and should not be considered as a solicitation to buy or sell any security. SCM cannot assess, verify or guarantee the suitability of any particular investment to any particular situation and the reader of this newsletter bears complete responsibility for its own investment research and should seek the advice of a qualified investment professional that provides individualized advice prior to making any investment decisions. All opinions expressed and information and data provided therein are subject to change without notice. SCM, its officers, directors, employees and/or affiliates, may have positions in, and may, from time-to-time make purchases or sales of the securities discussed or mentioned in the publications.
This Newsletter and others are available at smeadcap.com