
by Joseph V. Amato, President and Chief Investment Officer – Equities
Peter D’Onofrio, Senior Vice President, Product Management
Alessandra Rago, Associate, Corporate Development and Strategy, Neuberger Berman
With stock markets fueled by extraordinary central bank intervention in the wake of the Global Financial Crisis, passive equity strategies have seen great success in terms of performance, fund flows and press coverage. Often overlooked in the haste to declare a victor in the active/passive debate, however, is the fact that active outperformance has persisted across a wide swath of managers over various time periods and market regimes.
Executive Summary
- When performance is examined through a lens that better reflects investor experience, active managers have been much more successful over the past decade than is commonly realized.
- Instead of comparing the performance of an index against an entire universe of active strategies, it’s more appropriate to reframe the conversation to include only those managers in the top three quartiles of performance and thus eliminate a small cohort of poorly performing funds unlikely to attract significant investment flows. This comparison finds that approximately 80% of U.S. equity active managers1 have beaten the S&P 500 net of fees over the 20-year period ended December 2017.
- Rolling returns—rather than the static measurement periods favored by passive’s supporters—can offer a larger spectrum of performance over time while also better reflecting an investor’s buying and selling behavior.
- Relative performance during recent bear markets suggests that active managers may provide investors with downside mitigation when indexes are in sharp decline.
Active Outperformance Can Still Be Found
Percentage of Time Periods in Which U.S. Large Blend Active Funds Have Beaten the S&P 500 Index after Fees, January 1998 through December 2017

Source: Morningstar. Morningstar category net average annualized return covering 121 (rolling 10-year returns) or 181 (rolling 5-year returns) time periods (January 1998 through December 2017). Represents actively managed open-end U.S. domiciled funds, including funds that have been liquidated. Performance is based on funds’ oldest share class. Quartile rank is based on each 10- or 5-year rolling month-end time period. Star rating is based on funds’ “Overall Rating” as of each 10- or 5-year rolling month-end time period. Indices are unmanaged and are not available for direct investment. Investing entails risks, including possible loss of principal. Past performance is no guarantee of future results.
- Fueled by extraordinary global central bank intervention, equity markets have soared since their 2009 trough, leading to conditions unsupportive of traditional capitalism and active management, including high levels of correlation and low levels of dispersion. Stock correlations within the S&P 500, for example, have spiked 16% since May 2009, depriving active managers of the opportunity to distinguish winners from losers through fundamental research. Post-crisis market conditions also suggest that the past decade is not an ideal time frame over which to gauge an investment’s potential for long-term success across market cycles. We think central bank policy normalization could inspire a normalization in market dynamics.
The Passive Argument: Missing Pieces
- Proponents of passive investing over the past decade have maintained that an active approach does not provide alpha after fees. Often presented alongside this claim is evidence that fewer than 50% of active managers outperform their benchmark after fees over some static period of time.
- The passive argument ignores a number of important investor-specific considerations:
- The bull market that began in 2009 has been significant in both gain and duration. A view across market regimes—not just raging bulls—can show more clearly how different investment approaches may perform in less-frothy environments. Meanwhile, the extraordinary circumstances fueling this current market—and their impact on correlation and dispersion— are unlikely to persist indefinitely.
- Static time periods reflect only a snapshot of an investment’s performance. Rolling measurement periods, in contrast, consider a greater volume of performance data and may better depict an investor’s experience over time. Think still photography versus video.
- The next two charts depict a typical argument for passive investing—as well as what happens once we remove the poorest performers within each equity category from the comparison. While we’d argue that a static time period, particularly one that fails to capture a full market cycle, isn’t ideal in evaluating an investment, it is telling how the relative performance of active and passive shifts with the focus only on funds with a realistic hope of attracting assets.
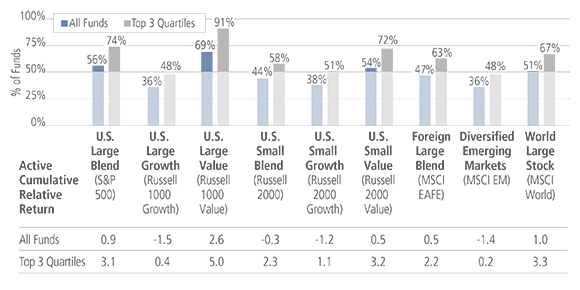
A Typical Passive Argument, Reconsidered—10 Years
Percentage of Active Funds that Have Outperformed the Index after Fees, January 2008 through December 2017
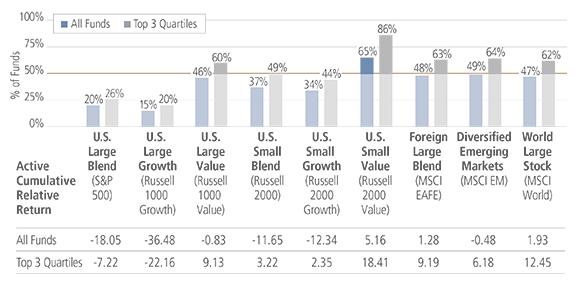
Source: Morningstar. Represents actively managed open-end U.S. domiciled funds. Performance is based on funds’ oldest share class. Quartile rank is based on the annualized 10-year return. “Active Cumulative Relative Return” is based on the Morningstar category averages. Indices are unmanaged and are not available for direct investment. Investing entails risks, including possible loss of principal. Past performance is no guarantee of future results.
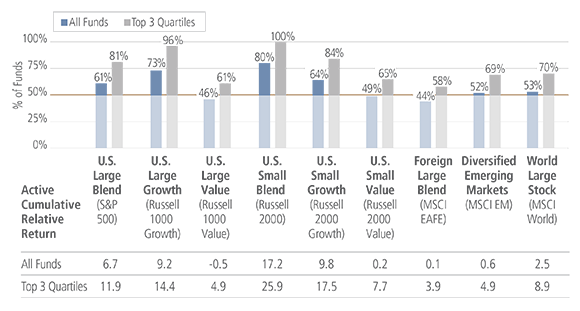
- Active managers can also sometimes provide staggering benefits to long-term investors. If the 10-year chart above highlights active management’s difficulties in the current market environment, the 20-year chart below suggests that active has performed quite well over periods that encompass multiple market cycles. Eliminating the bottom quartile of performers provides an even starker contrast between active and passive strategies’ historical returns.
A Typical Passive Argument, Reconsidered—20 Years
Percentage of Active Funds that Have Outperformed the Index after Fees, January 1998 through December 2017
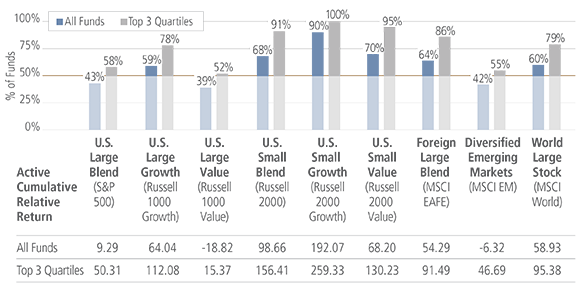
Source: Morningstar. Represents actively managed open-end U.S. domiciled funds. Performance is based on funds’ oldest share class. Quartile rank is based on the annualized 20-year return. “Active Cumulative Relative Return” is based on the Morningstar category averages. Indices are unmanaged and are not available for direct investment. Investing entails risks, including possible loss of principal. Past performance is no guarantee of future results.
Reframing the Debate
- We think it’s important to frame the active/passive comparison to reflect the nuances of an average investor’s experience over time. Here are a few critical elements to any real-life comparison of active and passive performance:
- The analysis should emphasize those funds investors tend to favor. Fund flows going back to 2007, depicted below, show that investors overwhelmingly have directed their investment flows to top-rated funds (i.e., those rated four or five stars by Morningstar) and that this trend has intensified since the Great Recession.
- Performance should be evaluated over multiple market cycles. A measurement period beginning in January 1998, for example, captures both bull and bear market periods, including the technology and financial bubbles.
- The more data the better. Performance should be considered over many time periods instead of only one that may differ dramatically from the norm. For example, rolling five-year and 10-year periods beginning in January 1998 capture 181 and 121 unique time periods, respectively, providing a more comprehensive view of an investment’s performance over the past 20 years.
Investors Have Favored Highly Rated Funds
Active Fund Flows by Morningstar RatingTM

Source: Morningstar. Represents actively managed open-end U.S. domiciled funds including funds that have been liquidated. Includes the following Morningstar Categories: U.S. Fund Large Blend, U.S. Fund Large Growth, U.S. Fund Large Value, U.S. Fund Small Blend, U.S. Fund Small Growth, U.S. Fund Small Value, U.S. Fund Diversified Emerging Markets, U.S. Fund World Large Stock and U.S. Fund Foreign Large Blend.
- Considering the historical fund flows depicted above, we sought to narrow the fund universe to better represent the product set investors have targeted. While most of the past decade has been challenging for active managers in aggregate, we showed earlier that removing only a small subset of the poorest performing funds results in a universe whose average return beat the index after fees more often than not.
- Eliminating that small group is only one way to reframe the active/passive argument. The next two charts also incorporate the impact of rolling returns on relative performance over a 20-year period that captures up, down and sideways markets and any distortions that have emerged over time.
- The first display considers active managers’ relative performance versus their benchmarks based on 10-year rolling returns since 1998, capturing 121 unique measurement periods, revealing:
- Removing the bottom quartile in each category only improved active’s success rates. Active managers outperformed their respective indexes after fees more than half the time in all nine categories, with managers in seven categories beating the index in at least 75% of the 121 measurement periods.
An Adjusted Opportunity Set Tells A Different Story Over Rolling 10-Year Periods…
Percentage of Time Periods Average Morningstar Category of Active Funds Outperformed Its Index after Fees Based on Rolling 10-Year Monthly Returns, January 1998 through December 2017 (121 Time Periods)
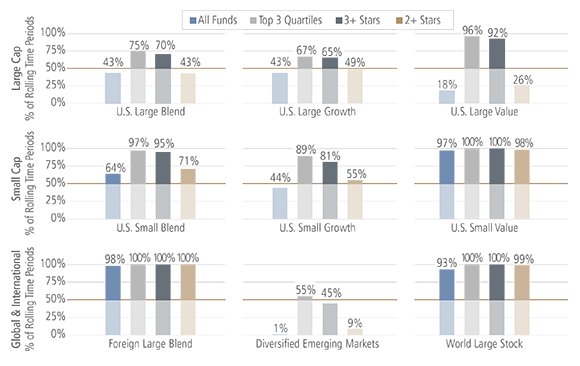
Source: Morningstar. Morningstar category net average annualized return covering 121 time periods (January 1998 through December 2017). Represents actively managed open-end U.S. domiciled funds, including funds that have been liquidated. Performance is based on funds’ oldest share class. Quartile rank is based on each 10-year rolling month-end time period. Star rating is based on funds’ “Overall Rating” as of each 10-year rolling month-end time period. Indices are unmanaged and are not available for direct investment. Investing entails risks, including possible loss of principal. Past performance is no guarantee of future results.
- As shown below, five-year rolling returns, capturing 181 unique measurement periods since January 1998, tell a similar story:
- Even though the universe as a whole didn’t do as well over the shorter evaluation periods, the top 75% of active managers outperformed their respective indexes after fees more often than not in all nine categories.
- Even more compelling, focusing on the top 75% of managers in each category shows that active management outperformed their respective indexes after fees at least 70% of the 181 time periods in this scenario in seven of the nine categories—four of which outperformed more than 90% of the time.
…And Rolling Five-Year Periods
Percentage of Time Periods Average Morningstar Category Outperformed Its Index after Fees Based on Rolling 5-Year Monthly Returns, January 1998 through December 2017 (181 Time Periods)
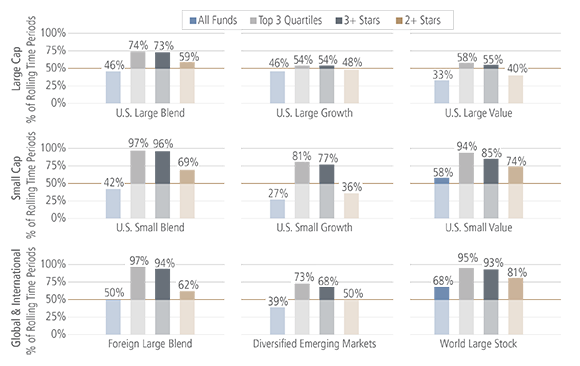
Source: Morningstar. Morningstar category net average annualized return covering 181 time periods (January 1998 through December 2017). Represents actively managed open-end U.S. domiciled funds including, funds that have been liquidated. Performance is based on funds’ oldest share class. Quartile rank is based on each 5-year rolling month-end time period. Star rating is based on funds’ “Overall Rating” as of each 5-year rolling month-end time period. Indices are unmanaged and are not available for direct investment. Investing entails risks, including possible loss of principal. Past performance is no guarantee of future results.
In short, when performance is considered across rolling time periods, actively managed funds have provided strong returns versus their respective indexes over multiple market cycles.
A Look at Downside Mitigation
- Given a bull market that recently eclipsed nine years in duration, investors have flocked to U.S. equity index funds, increasingly exposing their investments to the full downside risk of the market.
- Despite the lack of a significant market downturn in nearly a decade, it’s still important for investors to be prepared for the potential impact of a pullback in the market. We examined the two most recent bear markets—related to the bursting of the dot-com bubble in the early 2000s and the global financial crisis from 2007–09—and found that active strategies generally suffered smaller losses than their benchmarks during these periods of distress, which may suggest that passive strategies may carry more risk going forward than investors expect.
- Passive investments by design provide near-total exposure to the performance of a benchmark index, both when it’s rising and when it’s falling. Active managers, in contrast, have the ability to employ risk management techniques in an effort to protect portfolios from feeling the full force of a declining market.
- The chart below reflects performance during the dot-com crash, from September 2000 to February 2003:
- When all funds within a category were considered, more than half of active managers outperformed their respective benchmarks after fees in six of the nine categories. The rate of active outperformance was over 60% in four of these categories, with active managers posting a cumulative relative return greater than 6% in each of them.
- Removing the bottom quartile of funds from each category suggests even more consistent risk mitigation by active managers. No less than 58% of active funds outperformed their benchmarks in all nine categories. Seven categories saw outperformance by 65% or more, with managers in these categories delivering an excess return of at least 4.9%.
A Look at Active Managers During The Dot-Com Crash...
Percentage of Active Funds that Have Outperformed the Index After Fees, September 2000 through February 2003
Source: Morningstar. Represents actively managed open-end U.S. domiciled funds, including funds that have been liquidated. Performance is based on fund’s oldest share class. Quartile rank is based on the 9/2000 – 2/2003 time period. “Active Cumulative Relative Return” is based on the Morningstar category averages. For the period 9/2000 through 2/2003, All Funds and Top 3 Quartile Active Mutual Fund Cumulative Average Returns are as follows: U.S. Large Blend: -35.8%, -30.6%; U.S. Large Growth: -51.2%, -45.9%; U.S. Large Value: -21.3%, -15.9%; U.S. Small Blend: -13.3%, -4.7%; U.S. Small Growth: -44.8%, -37.1%; U.S. Small Value: 2.2%, 9.7%; Foreign Large Blend: -42.7%, -38.9%; Diversified Emerging Markets: -29.0%, -24.8%; World Large Stock: -41.1%, -34.8%. For the same period, index returns are as follows: S&P 500: -42.5%, Russell 1000 Growth: -60.3%, Russell 1000 Value: -20.8%, Russell 2000: -30.6%, Russell 2000 Growth: -54.5%, Russell 2000 Value: 2.0%; MSCI EAFE: -42.8%, MSCI EM: -29.7%, MSCI World: -43.6%.
This next chart depicts performance during the global financial crisis period of November 2007 through February 2009:
- Focusing on the top 75% of managers in each category found that more than half of active managers outperformed in seven of the nine categories, with five categories experiencing success rates greater than 60%.
- Additionally, when the bottom quartile of poor performers is removed from the comparison, active management delivered a favorable average cumulative relative return in all nine categories.
…And The Global Financial Crisis
Percentage of Active Funds that Have Outperformed the Index After Fees, November 2007 through February 2009
Source: Morningstar. Represents actively managed open-end U.S. domiciled funds, including funds that have been liquidated. Performance is based on fund’s oldest share class. Quartile rank is based on the 11/2007 – 2/2009 time period. “Active Cumulative Relative Return” is based on the Morningstar category averages. For the period 11/2007 through 2/2009, All Funds and Top 3 Quartile Active Mutual Fund Cumulative Average Returns are as follows: U.S. Large Blend: -50.1%, -47.8%; U.S. Large Growth: -49.5%, -47.6%; U.S. Large Value: -51.8%, -49.4%; U.S. Small Blend: -52.4%, -49.8%; U.S. Small Growth: -53.5%, -51.2%; U.S. Small Value: -51.4%, -48.7%, Foreign Large Blend: -56.1%, -54.4%; Diversified Emerging Markets: -62.8%, -61.2%, World Large Stock: -53.0%, -50.7%. For the same period, index returns are as follows: S&P 500: -50.9%, Russell 1000 Growth: -48.0%, Russell 1000 Value: -54.4%, Russell 2000: -52.0%, Russell 2000 Growth: -52.3%, Russell 2000 Value: -51.9%, MSCI EAFE: -56.7%, MSCI EM: -61.4%, MSCI World: -54.0%.
A Note on Morningstar RatingsTM
Morningstar launched its star rating system in 1985. In assessing their star rating system’s usefulness as a starting point for research, Morningstar research found that notwithstanding inherent limitations due to an emphasis on past performance, its rating system can be a useful starting point as it apparently “points investors toward cheaper funds that are easier to own and likelier to outperform in the future, qualities that correspond with investor success.”1 While Morningstar RatingsTM are not predictive of future performance, its research suggested that “higher-rated funds tend to suffer less downside volatility while living longer than lower-rated funds” and that “in general high-rated funds generated higher average excess returns (versus their category average peer) than lower-rated funds” in subsequent 30- and 60-month rolling periods.1
1 Jeffrey Ptak, CFA, “The Morningstar Rating for Funds: A Good Starting Point for Investors?” Morningstar.com, September 5, 2017. Among other things, the Morningstar research sought to evaluate the success of its rating system based on how funds performed subsequent to receiving a star rating, with an interest in knowing the extent to which rated funds’ returns surpassed (or lagged) the average for the category over a subsequent event horizon. The research included all classes of U.S. open-ended funds, including dead funds. The level of risk taken in generating excess returns was not considered.
The Impact of Massive Central Bank Stimulus—and Its Unwind
- Highly stimulative monetary policy in response to the financial crisis has been fueling a rise in equity markets while also suppressing the dynamics that provide opportunities for active outperformance.
- With the global economy and financial markets on the verge of collapse in 2007, governments worldwide introduced massive stimulus to fend off disaster. The Fed slashed its overnight rate from 5.25% in September 2007 to near zero by the end of 2008. It also initiated three rounds of quantitative easing from March 2009 to October 2014, during which it purchased more than $2.5 trillion of U.S. Treasuries, agency debt and mortgage-backed securities, expanding its balance sheet to nearly $4.5 trillion.
- By reducing the cost of capital to near zero during that time period, Fed stimulus made risk assets more attractive on a relative basis and distorted equity market dynamics—including correlation and dispersion—that allow managers to distinguish among stocks through fundamental research. Correlation measures the degree to which stocks move in relation to one another, while dispersion tracks the magnitude of relative performance. Low correlation (an abundance of stocks whose movements are not closely aligned) and high dispersion (wide differences between the best and worst performing stocks within an index) afford greater opportunity for fundamental active management to identify winners from losers. Trends in these metrics since the financial crisis have favored passive:
- Average rolling one-month correlation of stocks within the S&P 500 Index rose to 0.56 from May 2009 through December 2017 compared to an average of 0.49 from January 1998 through April 2009—a 16% increase.
- Average rolling one-month stock return dispersion between the 5th percentile and 95th percentile securities in the S&P 500 Index fell to 20.5% from May 2009 through December 2017 compared to an average of 30.3% from January 1998 through April 2009—a 32% decline.
- Post-recession, stocks increasingly moved in lock step directionally while realizing less difference in price performance. This meant more winners and fewer losers—and a much more difficult environment for individual security selection.
Correlation And Dispersion Trends Post-Crisis Have Supported Passive
January 1998 through December 2017

Source: FactSet.
Note: Correlation is represented by average 1-month rolling stock correlation among securities in the S&P 500 Index. Dispersion is represented by 1-month rolling stock return dispersion between the 5th percentile and 95th percentile securities in the S&P 500 Index.
- From these conditions came the second-longest bull market in history, as seen in the chart below, and the embrace of passive strategies in the process. Slow normalization of central bank policy already underway likely will result in an environment more supportive of active investment—one with increased market volatility along with lower correlations and higher dispersions among stocks and sectors.
- Normalization in correlation metrics has been evident since the time of the Brexit vote in June 2016:
- The average rolling one-month correlation of the S&P 500 Index from June 2016 through December 2017 is 35% lower than for the period May 2009 to May 2016.
- Correlation averaged 0.60 from May 2009 to May 2016, dropping below 0.40 in only one of these 86 months. In contrast, correlation has averaged 0.39 since June 2016 and was below 0.40 for 11 of the 18 months during the period.
- Notably, the average correlation in 2017 was 0.36.
The Market’s Long Recovery
Comparison of S&P 500 Bull Markets January 1932 through December 2017

Source: Strategies Research Partners. Indices are unmanaged and are not available for direct investment. Investing entails risks, including possible loss of principal. Past performance is no guarantee of future results.
Have ETFs Delivered in This Perfect Passive Environment?
- You’d be hard-pressed to find a situation better suited to passive investing than the prevailing beta-driven market over the past eight-plus years. Despite significant tailwinds, however, achieving market-level returns via ETF investments has not been guaranteed, as shown below.
- ETFs, like traditional mutual funds, charge management fees that detract from the products’ net asset value and, in many instances, prevent an ETF from matching the performance of the index it tracks. They also incur shareholder transaction costs through brokerage commissions and/or bid-ask spreads—costs that take away from an investor’s actual return even if not captured in an ETF-reported performance.
ETFs Haven’t Always Kept Pace
Five-Year Annualized Relative Return of the Largest ETF in Each Category
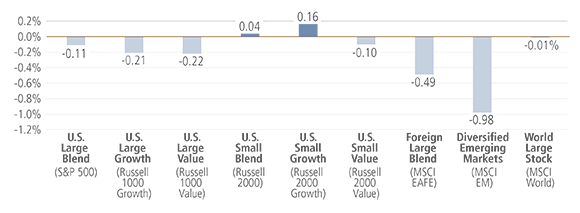
Source: FactSet. Data as of December 31, 2017. Represents spread versus the index. Largest ETF was based on assets under management in the Morningstar category as of December 31, 2017. Indices are unmanaged and are not available for direct investment. Investing entails risks, including possible loss of principal. Past performance is no guarantee of future results.
Conclusion
- Passive investments have thrived in recent years as extraordinary central bank intervention post-crisis fueled the rise of equity indexes and suppressed market dynamics that, under normal circumstances, can provide active managers with opportunities to distinguish among stocks through fundamental research.
- Even so, alpha hasn’t been as elusive as conventional wisdom makes it out to be. In fact, reframing the active/passive comparison to better reflect the average investor’s experience—simply by cutting poor performers unlikely to be considered for investment and employing rolling returns data across full market cycles—reveals that despite considerable headwinds, active outperformance has persisted across a wide swath of managers and over a variety of time periods and market regimes.
- Given the duration of the current bull market, downside mitigation—which only active managers are able to provide—may be an increasingly important investment consideration.
This material is provided for informational purposes only and nothing herein constitutes investment, legal, accounting or tax advice, or a recommendation to buy, sell or hold a security. This material is general in nature and is not directed to any category of investors and should not be regarded as individualized, a recommendation, investment advice or a suggestion to engage in or refrain from any investment-related course of action. Neuberger Berman is not providing this material in a fiduciary capacity and has a financial interest in the sale of its products and services. Neuberger Berman, as well as its employees, does not provide tax or legal advice. You should consult your accountant, tax adviser and/or attorney for advice concerning your particular circumstances. Information is obtained from sources deemed reliable, but there is no representation or warranty as to its accuracy, completeness or reliability. All information is current as of the date of this material and is subject to change without notice. Any views or opinions expressed may not reflect those of the firm as a whole. Third-party economic or market estimates discussed herein may or may not be realized and no opinion or representation is being given regarding such estimates. Neuberger Berman products and services may not be available in all jurisdictions or to all client types. The use of tools cannot guarantee performance. Diversification does not guarantee profit or protect against loss in declining markets. As with any investment, there is the possibility of profit as well as the risk of loss. Investing entails risks, including possible loss of principal. Investments in hedge funds and private equity are speculative and involve a higher degree of risk than more traditional investments. Investments in hedge funds and private equity are intended for sophisticated investors only. Unless otherwise indicated, returns reflect reinvestment of dividends and distributions. Indexes are unmanaged and are not available for direct investment. Past performance is no guarantee of future results.
Correlation is a statistical measure of how a portfolio moves in relation to its benchmark. Correlation values range from +1.0 to -1.0. A positive correlation implies that they move in the same direction. Negative correlation means they move in opposite paths. A correlation of +1.0 means that the portfolio and benchmark move in exactly the same direction; -1.0 means they move in exactly the opposite direction; 0.0 means they do not correlate at all with each other.
Dispersion is a statistical measure of how much the returns of each variable (i.e. stocks within a benchmark) differ from the average return of an index.
The S&P 500 Index is a float-adjusted market capitalization-weighted index that focuses on the large-cap segment of the U.S. equity market, and includes a significant portion of the total value of the market.
The Russell 2000® Index is a float-adjusted market capitalization-weighted index that measures the performance of the small-cap segment of the U.S. equity market. It includes approximately 2,000 of the smallest securities in the Russell 3000 Index (which measures the performance of the 3,000 largest U.S. public companies based on total market capitalization). The index is rebalanced annually in June.
The Russell 2000 Growth Index is a float-adjusted market capitalization-weighted index that measures the performance of the small-cap growth segment of the U.S. equity market. It includes those Russell 2000 Index companies with higher price-to-book ratios and higher forecasted growth rates. The index is rebalanced annually in June.
The Russell 2000 Value Index is a float-adjusted market capitalization-weighted index that measures the performance of the small-cap value segment of the U.S. equity market. It includes those Russell 2000 Index companies with lower price-to-book ratios and lower forecasted growth rates. The index is rebalanced annually in June.
The Russell 1000 Index is a float-adjusted market capitalization-weighted index that measures the performance of the large-cap segment of the U.S. equity market. It includes approximately 1,000 of the largest securities in the Russell 3000 Index (which measures the performance of the 3,000 largest U.S. public companies based on total market capitalization). The index is rebalanced annually in June.
The Russell 1000 Growth Index is a float-adjusted market capitalization-weighted index that measures the performance of the large-cap growth segment of the U.S. equity market. It includes those Russell 1000 Index companies with higher price-to-book ratios and higher forecasted growth rates. The index is rebalanced annually in June.
The Russell 1000 Value Index is a float-adjusted market capitalization-weighted index that measures the performance of the large-cap value segment of the U.S. equity market. It includes those Russell 1000 Index companies with lower price-to-book ratios and lower forecasted growth rates. The index is rebalanced annually in June.
The Russell 3000 Index is a float-adjusted market capitalization-weighted index that measures the performance of the 3,000 largest U.S. public companies based on total market capitalization. The index is rebalanced annually in June.
The MSCI EAFE® Index (Europe, Australia, Far East) is a free float-adjusted market capitalization index that is designed to measure the equity market performance of developed markets, excluding the U.S. and Canada. As of November 27, 2013, the MSCI EAFE® Index consist of the following 21 developed market country indices: Australia, Austria, Belgium, Denmark, Finland, France, Germany, Hong Kong, Ireland, Israel, Italy, Japan, the Netherlands, New Zealand, Norway, Portugal, Singapore, Spain, Sweden, Switzerland, and the United Kingdom. Net total return indexes reinvest dividends after the deduction of withholding taxes, using (for international indexes) a tax rate applicable to non-resident institutional investors who do not benefit from double taxation treaties. Gross total return indexes reinvest as much as possible of a company’s dividend distributions, regardless of withholding taxes that a non-resident may experience.
The MSCI® Emerging Markets Index is a free float-adjusted market capitalization-weighted index that is designed to measure the equity market performance of emerging markets. The index consists of the following 24 emerging market country indexes: Brazil, Chile, China, Colombia, Czech Republic, Egypt, Greece, Hungary, India, Indonesia, Korea, Malaysia, Mexico, Pakistan, Peru, the Philippines, Poland, Qatar, Russia, South Africa, Taiwan, Thailand, Turkey and the UAE. Net total return indexes reinvest dividends after the deduction of withholding taxes, using (for international indexes) a tax rate applicable to non-resident institutional investors who do not benefit from double taxation treaties.
The MSCI® World Index (Net) is a broad global equity benchmark that represents large and mid-cap equity performance across 23 developed markets countries: Australia, Austria, Belgium, Canada, Denmark, Finland, France, Germany, Hong Kong, Ireland, Israel, Italy, Japan, the Netherlands, New Zealand, Norway, Portugal, Singapore, Spain, Sweden, Switzerland, the United Kingdom, and the United States. It covers approximately 85% of the free float-adjusted market capitalization in each country and does not offer exposure to emerging markets.
Morningstar Large Blend Category funds are fairly representative of the overall U.S. stock market in size, growth rates, and price. Stocks in the top 70% of the capitalization of the U.S. equity market are defined as large cap. The blend style is assigned to portfolios where neither growth nor value characteristics dominate. These portfolios tend to invest across the spectrum of U.S. industries, and owing to their broad exposure, the portfolios’ returns are often similar to those of the S&P 500 Index.
Morningstar Large Growth Category funds invest primarily in big U.S. companies that are projected to grow faster than other large-cap stocks. Stocks in the top 70% of the capitalization of the U.S. equity market are defined as large cap. Growth is defined based on fast growth (high growth rates for earnings, sales, book value, and cash flow) and high valuations (high price ratios and low dividend yields). Most of these portfolios focus on companies in rapidly expanding industries.
Morningstar Large Value Category funds invest primarily in big U.S. companies that are less expensive or growing more slowly than other large-cap stocks. Stocks in the top 70% of the capitalization of the U.S. equity market are defined as large cap. Value is defined based on low valuations (low price ratios and high dividend yields) and slow growth (low growth rates for earnings, sales, book value, and cash flow).
Morningstar Small Blend Category funds favor U.S. firms at the smaller end of the market-capitalization range. Some aim to own an array of value and growth stocks while others employ a discipline that leads to holdings with valuations and growth rates close to the small-cap averages. Stocks in the bottom 10% of the capitalization of the U.S. equity market are defined as small cap. The blend style is assigned to portfolios where neither growth nor value characteristics predominate.
Morningstar Small Growth Category funds focus on faster-growing companies whose shares are at the lower end of the market-capitalization range. These portfolios tend to favor companies in up-and-coming industries or young firms in their early growth stages. Because these businesses are fast-growing and often richly valued, their stocks tend to be volatile. Stocks in the bottom 10% of the capitalization of the U.S. equity market are defined as small cap. Growth is defined based on fast growth (high growth rates for earnings, sales, book value, and cash flow) and high valuations (high price ratios and low dividend yields).
Morningstar Small Value Category funds invest in small U.S. companies with valuations and growth rates below other small-cap peers. Stocks in the bottom 10% of the capitalization of the U.S. equity market are defined as small cap. Value is defined based on low valuations (low price ratios and high dividend yields) and slow growth (low growth rates for earnings, sales, book value, and cash flow).
Morningstar Foreign Large Blend Category funds invest in a variety of big international stocks. Most of these portfolios divide their assets among a dozen or more developed markets, including Japan, Britain, France and Germany. These portfolios primarily invest in stocks that have market caps in the top 70% of each economically integrated market (such as Europe or Asia ex-Japan). The blend style is assigned to portfolios where neither growth nor value characteristics predominate. These portfolios typically will have less than 20% of assets invested in U.S. stocks.
Morningstar Diversified Emerging Markets Category funds tend to divide their assets among 20 or more nations, although they tend to focus on the emerging markets of Asia and Latin America rather than on those of the Middle East, Africa, or Europe. These portfolios invest at least 70% of total assets in equities and invest at least 50% of stock assets in emerging markets.
Morningstar World Stock Category funds have few geographical limitations. It is common for these portfolios to invest the majority of their assets in the U.S., Europe and Japan, with the remainder divided among the globe’s smaller markets. These portfolios typically have 20% – 60% of assets in U.S. stocks.
Morningstar Ratings are ©2018 Morningstar, Inc. All Rights Reserved. The Morningstar Ratings information contained herein: (1) is proprietary to Morningstar and/or its content providers; (2) may not be copied or distributed; and (3) is not warranted to be accurate, complete or timely. Neither Morningstar nor its content providers are responsible for any damages or losses arising from any use of such information.
This material is being issued on a limited basis through various global subsidiaries and affiliates of Neuberger Berman Group LLC. Please visit www.nb.com/disclosure-global-communications for the specific entities and jurisdictional limitations and restrictions.
The “Neuberger Berman” name and logo are registered service marks of Neuberger Berman Group LLC.
©2018 Neuberger Berman Group LLC. All rights reserved.