by Ryan Detrick, LPL Research
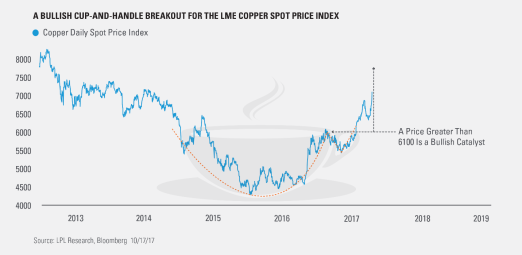
The London Metal Exchange (LME) is one of the primary trading venues for copper. And as it stands, the LME Copper spot price index continues to show signs of a break out of a multi-year base in the form of a bullish cup-and-handle chart pattern.
A bullish cup-and-handle is described by technical analysts as a continuation-type pattern in which the price consolidates into what resembles a tea cup, followed by a breakout in the form of the cup’s handle. If this type of chart pattern executes, then based on historical data, the commodity spot price is likely to climb higher over the long term. To determine how much higher the price is likely to move following a breakout, you simply measure the price change from the bottom of the cup to the beginning of the handle, and add that value to the top of the handle. The final number is your bullish price objective.
The current pattern for the LME Copper spot price index, which began in January 2015, took approximately two years to form its base, or cup. As seen in the chart below, between February and July 2017, the handle became more visible. And in August 2017, the index price remained above the 6,100 level for more than three trading days, which increased the likelihood that the pattern would execute to the upside, and the price would continue higher over the long-term time horizon.
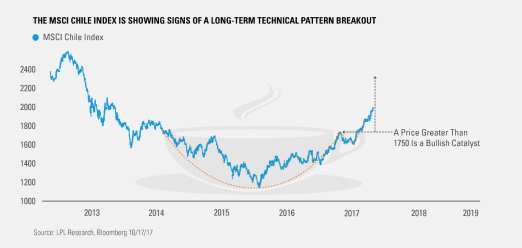
With the long-term trends in copper continuing to look more bullish, countries that manufacture copper, such as Chile, are showing signs of upward momentum. The MSCI Chile Index, much like that of copper, began exhibiting characteristics of a long-term bullish cup-and-handle pattern in August 2014 and has been forming its cup over an approximately 2.5-year time horizon. The chart below shows that between April and July 2017, the handle became more visible. This past August, on and around the same time as copper, the MSCI Chile Index price executed a bullish catalyst by remaining above the 1750 level for more than three trading days, which increased the likelihood that the pattern would execute to the upside, and the price would continue higher over the next 3–12 months.
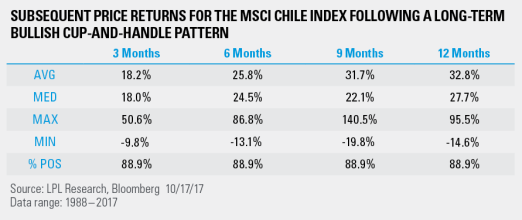
Looking at historical data going back to 1988 in the table below, there were 9 instances when the MSCI Chile Index executed a long-term bullish cup-and-handle chart pattern (on average lasting over 320 days), and both average and median returns over the subsequent 3- to 12-month periods were impressive.
The recent cup-and-handle pattern breakout on both the LME Copper spot price and MSCI Chile indexes are providing initial signals that the longer-term trend may be changing, increasing the likelihood that both index prices may move higher. This may provide investors with an opportunity to diversify their portfolios with either a commodity or emerging market country asset class. But as always, we believe it is prudent to wait for further confirmation of these types of long-term trend reversals prior to investing, in order to help mitigate the risk of a false signal. Stay tuned to the LPL Research blog for future analysis of commodity-related asset classes.
IMPORTANT DISCLOSURES
Past performance is no guarantee of future results. All indexes are unmanaged and cannot be invested into directly. The opinions voiced in this material are for general information only and are not intended to provide or be construed as providing specific investment advice or recommendations for any individual security.
The economic forecasts set forth in the presentation may not develop as predicted.
Investing in stock includes numerous specific risks including: the fluctuation of dividend, loss of principal, and potential illiquidity of the investment in a falling market.
Stock investing involves risk including loss of principal.
To the extent you are receiving investment advice from a separately registered independent investment advisor, please note that LPL Financial LLC is not an affiliate of and makes no representation with respect to such entity.
Not FDIC/NCUA Insured | Not Bank/Credit Union Guaranteed | May Lose Value | Not Guaranteed by any Government Agency | Not a Bank/Credit Union Deposit
Securities and Advisory services offered through LPL Financial LLC, a Registered Investment Advisor Member FINRA/SIPC
London Metal Exchange (LME) Copper cash is the cash price from the LME’s final evening evaluations.
The MSCI Chile Index is a free-float weighted equity index. It was developed with a base value of 100 as of December 31, 1987.
Tracking #1-656854 (Exp. 10/18)
Copyright © LPL Research


