by Don Vialoux, Timingthemarket.ca
Another Milestone
Number of followers to EquityClock’s StockTwits passed 28,000 yesterday. Previous milestone was set at 27,000 on August 19th
Observations
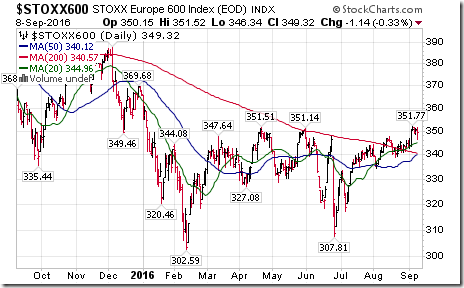
Reponses by European equity markets were muted at best following Draghi’s ECB comments yesterday
Interesting comments on CNBC about the performance of U.S. equity markets in the month of September
http://www.cnbc.com/2016/09/07/120-years-of-history-point-to-a-september-slide-for-stocks.html
Interesting article from CNBC connecting recessions and performance of U.S. equity markets in the first year after a new U.S. President is elected
http://www.cnbc.com/2016/09/07/presidential-elections-and-recessions-can-have-a-lot-in-common.html
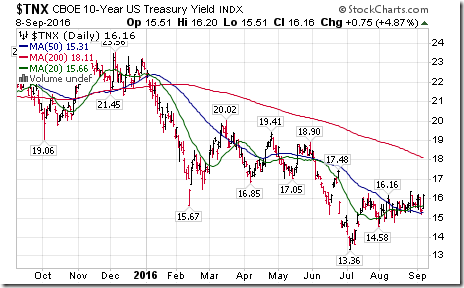
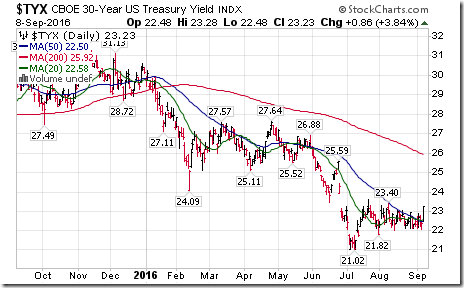
Traders are watching Treasury yields closely. A move by 10 year treasuries above resistance at 1.635% and 30 year treasuries above 2.359% will change intermediate trend from down to up and could trigger significant weakness in both the bond and stock markets.
StockTwits Released Yesterday @EquityClock
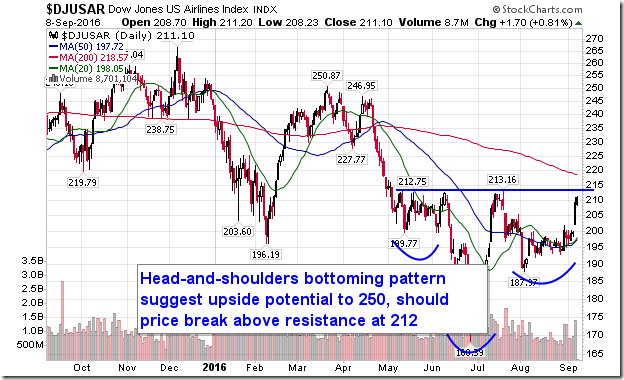
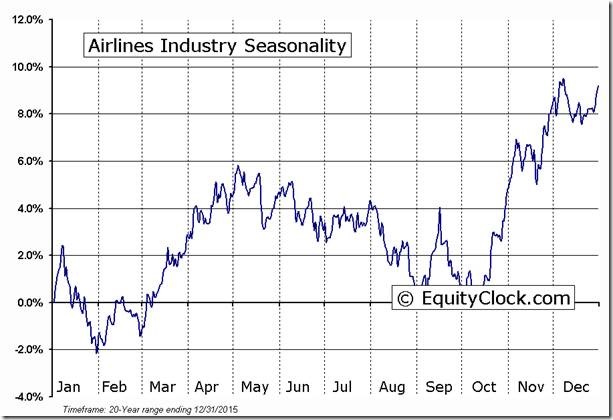
Airline stocks taking off!
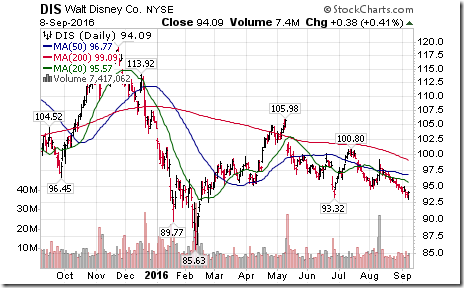
Technical action by S&P 500 stocks to 3:00: Mixed. 11 stocks broke resistance (including $CVX, $XOM) and 9 stocks broke support (including $DIS).
Editor’s Note: After 3:00 PM EDT, Apache (APA) broke resistance and Fortune Brands (FBHS)
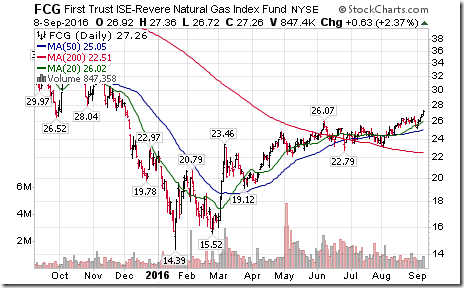
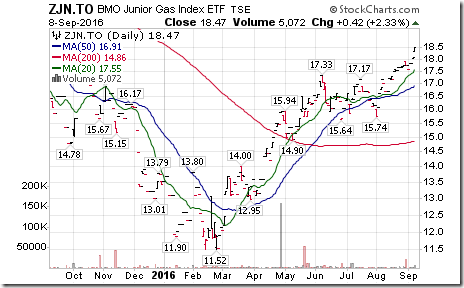
Most of the breakouts were energy stocks on higher crude oil and natural gas prices. $CHK, $COG, $CVX, $KMI, $MRO, $NBL $SWN, $XOM
Editor’s Note: “Gassy” stocks and related ETFs led the sector.
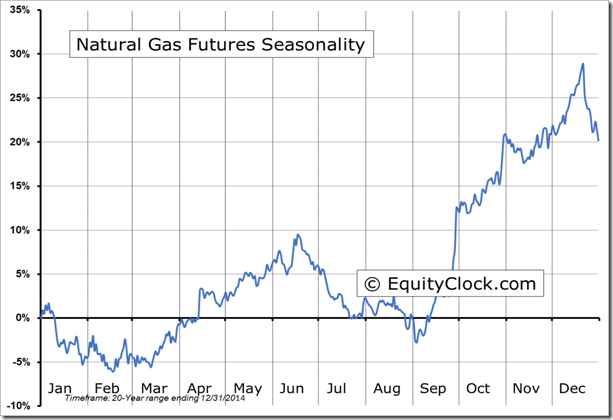
‘Tis the season for strength in natural gas prices! $UNG
$Disney $DIS notable on the list of stocks breaking support on a move below $93.32 extending intermediate downtrend.
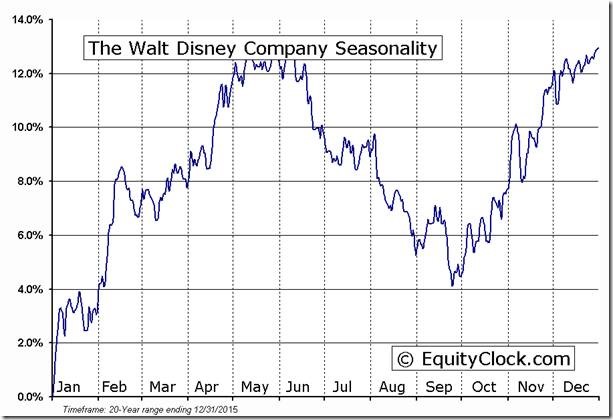
‘Tis the season for weakness in Walt Disney $DIS to the end of September!
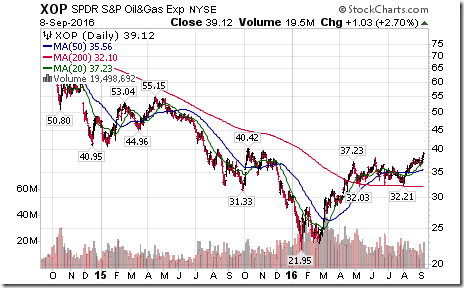
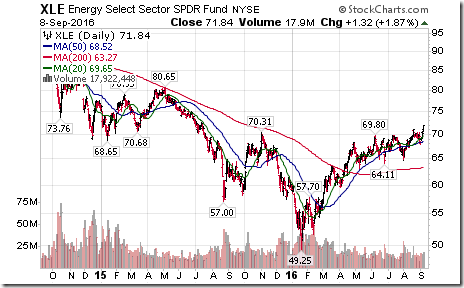
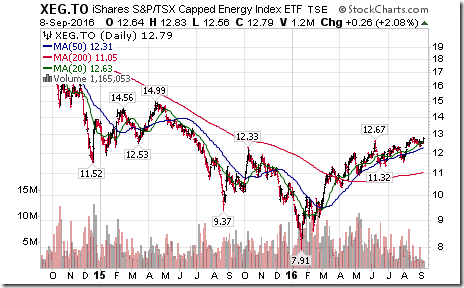
Energy ETFs breaking to new highs extending intermediate uptrends: $XLE, $XOP, XEG.TO
Trader’s Corner
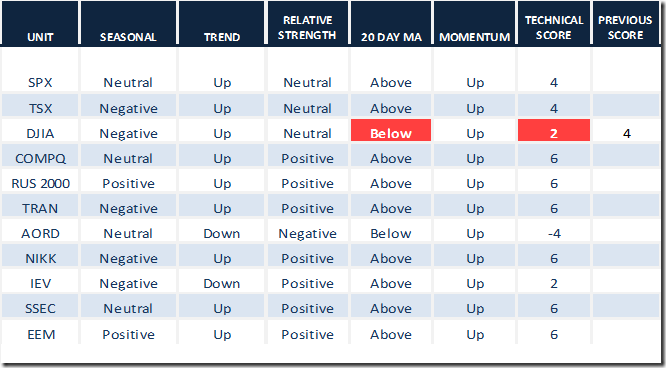
Daily Seasonal/Technical Equity Trends for September 8th 2016
Green: Increase from previous day
Red: Decrease from previous day
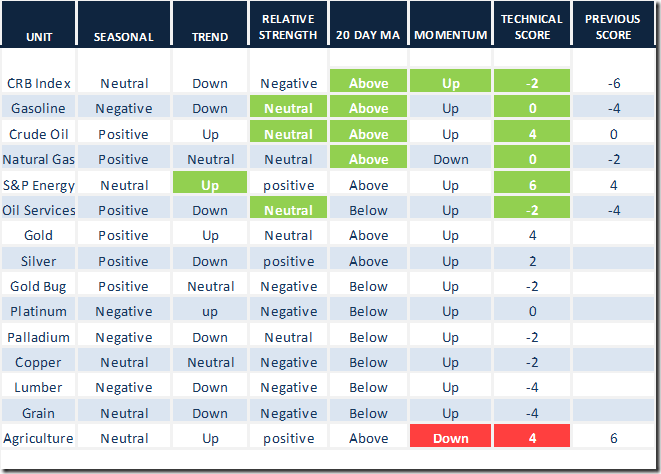
Daily Seasonal/Technical Commodities Trends for September 8th 2016
Green: Increase from previous day
Red: Decrease from previous day
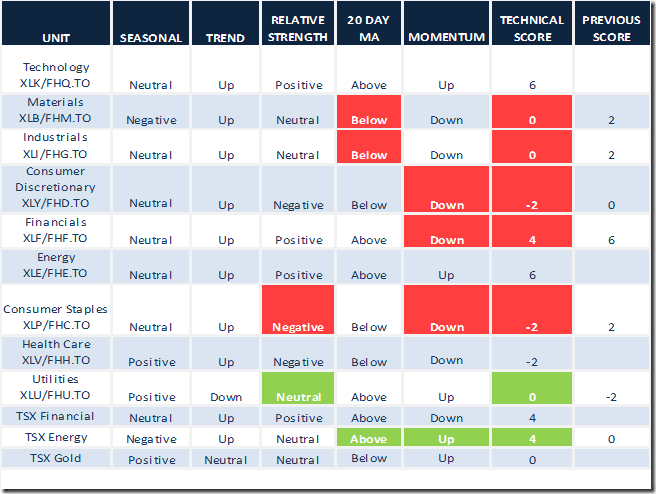
Daily Seasonal/Technical Sector Trends for September 8th 2016
Green: Increase from previous day
Red: Decrease from previous day
Special Free Services available through www.equityclock.com
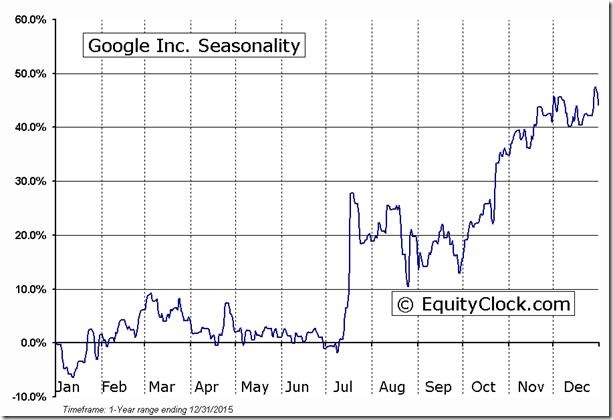
Equityclock.com is offering free access to a data base showing seasonal studies on individual stocks and sectors. The data base holds seasonality studies on over 1000 big and moderate cap securities and indices. To login, simply go to http://www.equityclock.com/charts/ Following are examples:
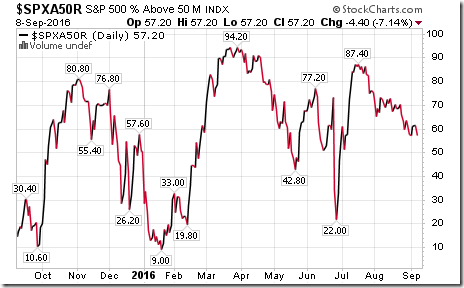
S&P 500 Momentum Barometer
The Barometer dropped 4.40 to 57.20 yesterday. It remains intermediate overbought and trending down.
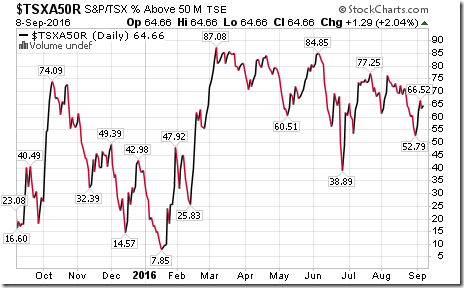
TSX Momentum Barometer
The Barometer added 1.29 to 64.66 yesterday. It remains intermediate overbought and trending down.
Disclaimer: Seasonality and technical ratings offered in this report by www.timingthemarket.ca and www.equityclock.com are for information only. They should not be considered as advice to purchase or to sell mentioned securities. Data offered in this report is believed to be accurate, but is not guaranteed
Copyright © DV Tech Talk, Timingthemarket.ca


