Is the S&P 500 Ready to Rally?
by Tiho Brkan, The Short Side of Long
The bull market in US equities (NYSE: SPY), which started in March 2009, has been anything but quiet and calm. For years, volatility has been one of the leading points of discussion and the main reason majority of retail investors have stayed out of the market. The rally out of March 2009 lows was incredibly powerful. Just as equally, corrections in May 2010 (Flash Crash) and August 2011 (Debt Ceiling) shook out majority of investors, who were expecting a repeat of the ’08 Global Financial Crisis. Moreover, the lift off in equity prices from November 2012 has been equally as robust. US equities have now rallied for almost 4 years without a 10% correction. Even more interesting is the fact that the tight range for the last half year is pretty much a historical anomaly.
Cumulative readings of stock market sentiment surveys shows elevated pessimism
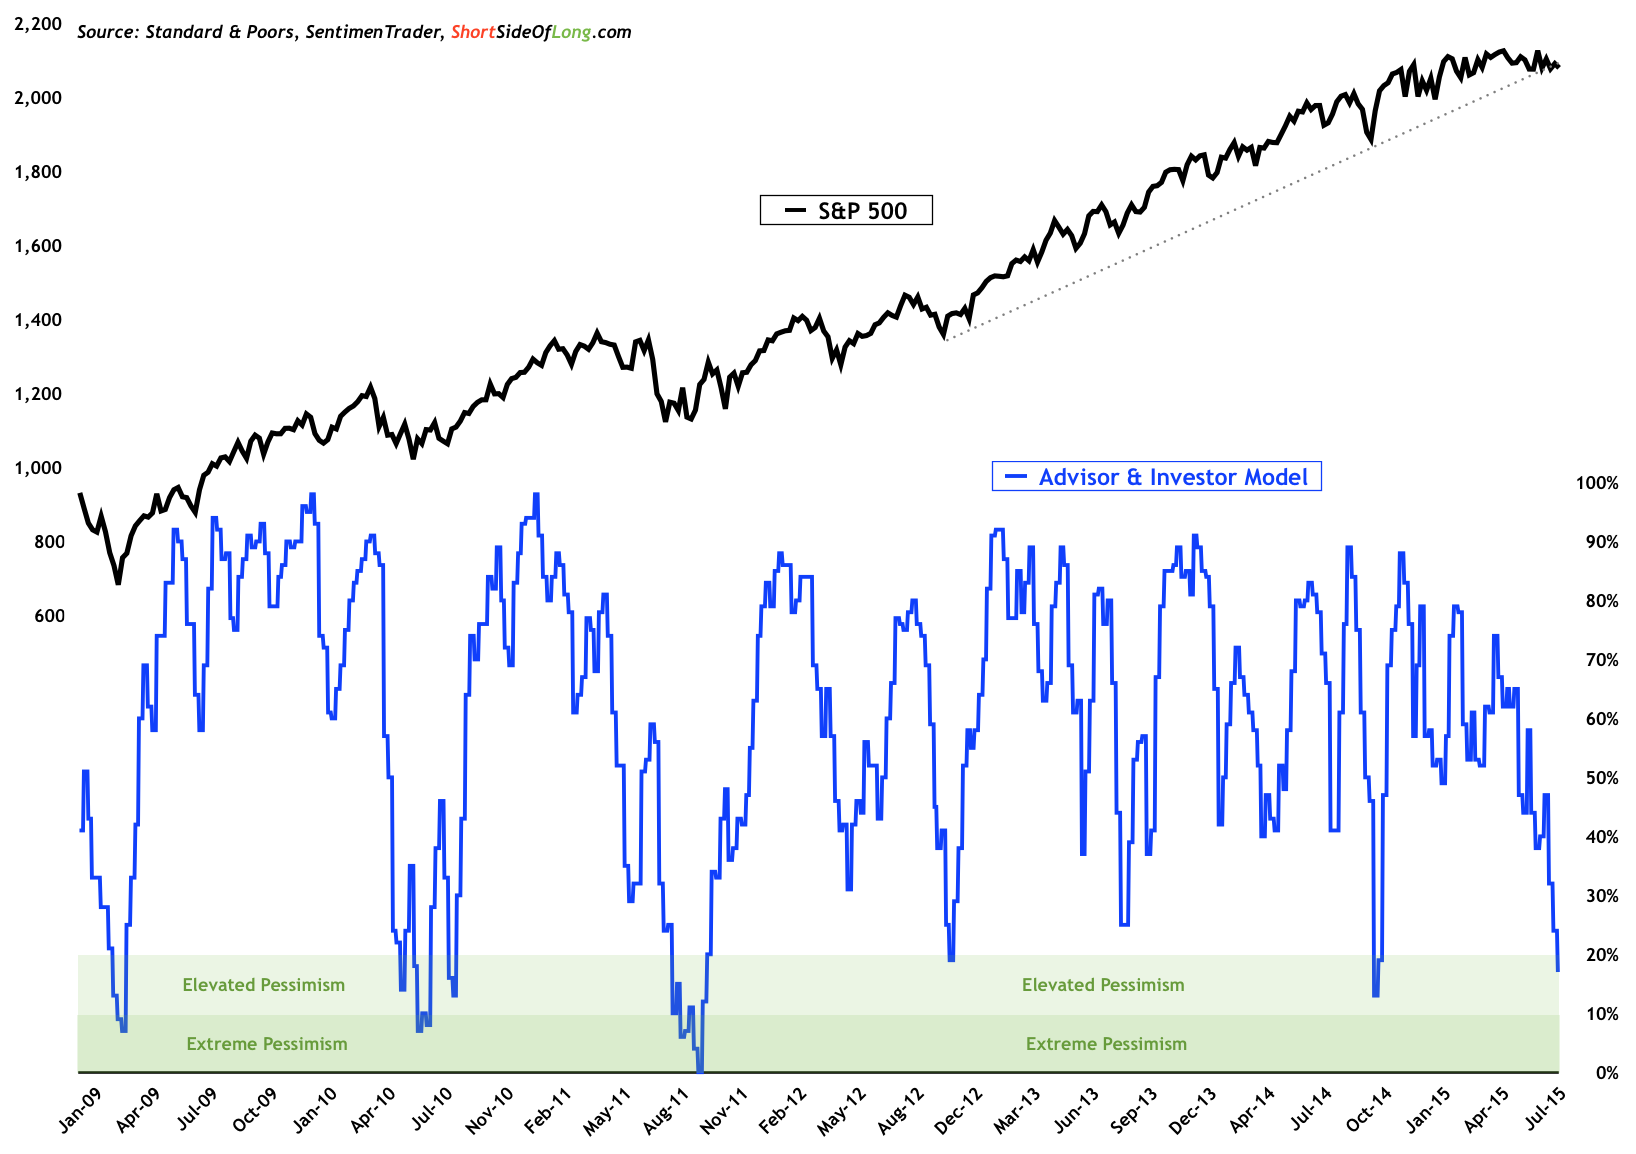 Source: Short Side of Long
Despite the fact that S&P 500 has only corrected by minuscule 4% since the peak in May of this year, cumulative number of stock market sentiment surveys have dropped to levels of pessimism usually associated with major corrections or even bear markets. At the reading of 17 percent bulls (thanks to SentimenTrader research), the mood of investors is now almost as negative as it was during October 2014 correction. Furthermore, it is clear that pessimism is also at the second lowest reading in over 3 years. Could the stock market decline, despite of low sentiment readings? Of course it could. We have seen stocks constantly disappoint throughout the 2008 bear market, despite elevated pessimism.
Lower grade investment and junk grade bond credit spreads have jumped recently
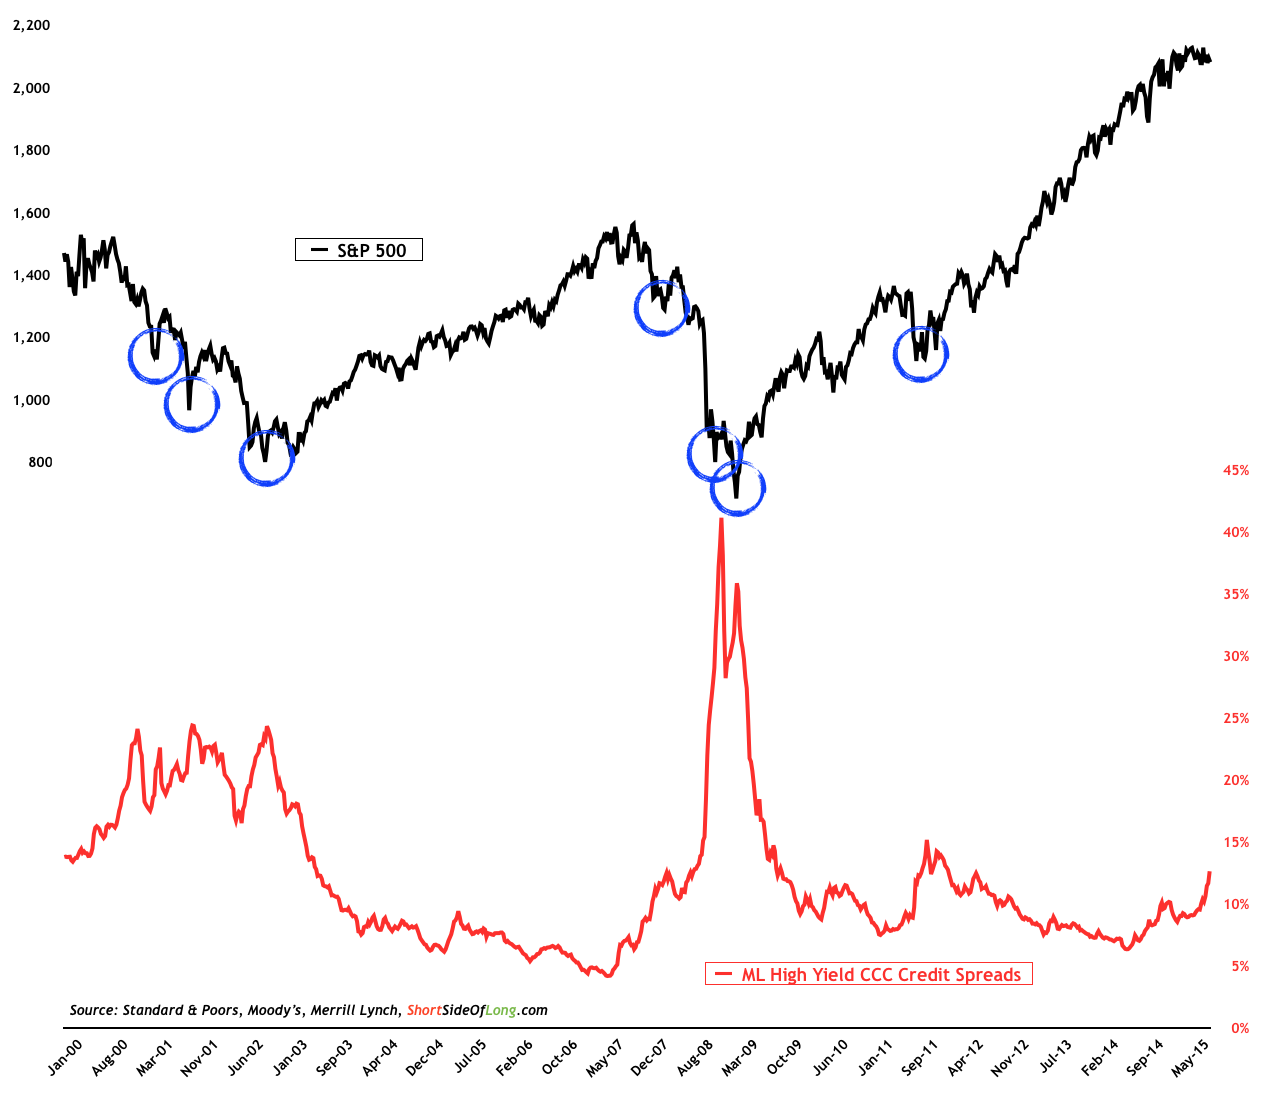 Source: Short Side of Long
Sentiment isn’t the only indicator that signals short term oversold condition for the stock market. Merrill Lynch’s High Yield Credit Spreads (NYSE: HYG) have recently spiked towards levels not seen since 2012. Whenever junk bond yields spike relative to the Treasury yields, it usually signals that market participants are running for the hills. In other words, this type of behaviour is classic risk aversion, where purchases of safe havens increase relative to lower grade asset quality. Could credit spreads rise much further? Of course they could. We have seen the CCC junk bond spreads rise above 20% during the 2000-03 and 2007-09 bear markets.
Such a high number of 52 week new lows is usually associated with intermediate bottoms
 Source: Short Side of Long
Finally, stock market breadth readings are confirming the risk aversion observed in both sentiment and credit. When averaged over one trading month (or 21 business days), the number of NYSE 52 week new lows has risen to October 2014 levels, just as the market was finding a bottom. Furthermore, once again there are now signs that selling is becoming exhausted. Since the beginning of June, 38 out of 55 trading days have had negative breadth readings, where the number of 52 week new lows exceeded 52 week highs. This type of selling pressure is usually associated with intermediate degree market bottoms. Readers should remember that historically, regardless of the trend, selling pressure can not persist forever. Even during the great bear market of 2008, selling pressure would rise and retreat.
In my opinion, elevated indicator readings (charts above) like we have today will eventually mean revert, at least for awhile, and should push the stock market a little bit higher. On the other hand… if negative sentiment, elevated credit spreads and oversold breadth cannot help the equities rally, it will be a sign that trouble is directly ahead.
Copyright © Tiho Brkan, The Short Side of Long