by Tiho Brkan, Short Side of Long
As promised earlier today, in early morning Asian trade (yes that was a long time ago), I shall post several charts above how major assets are at inflection points. Second chart of the day moves away from the US Treasury Note and refocuses our attention on global stock markets.
In the grid below, we can see that the All Country World Index priced in US Dollars, is attempting to break its support line on the downside. This uptrend line support has been in place since March 2009, the beginning of the bull market. Not all is well with global stocks, Greece is probably not the major catalyst.
Chart Of The Day: Many global stock indices are now at critical support

Source: Short Side Of Long
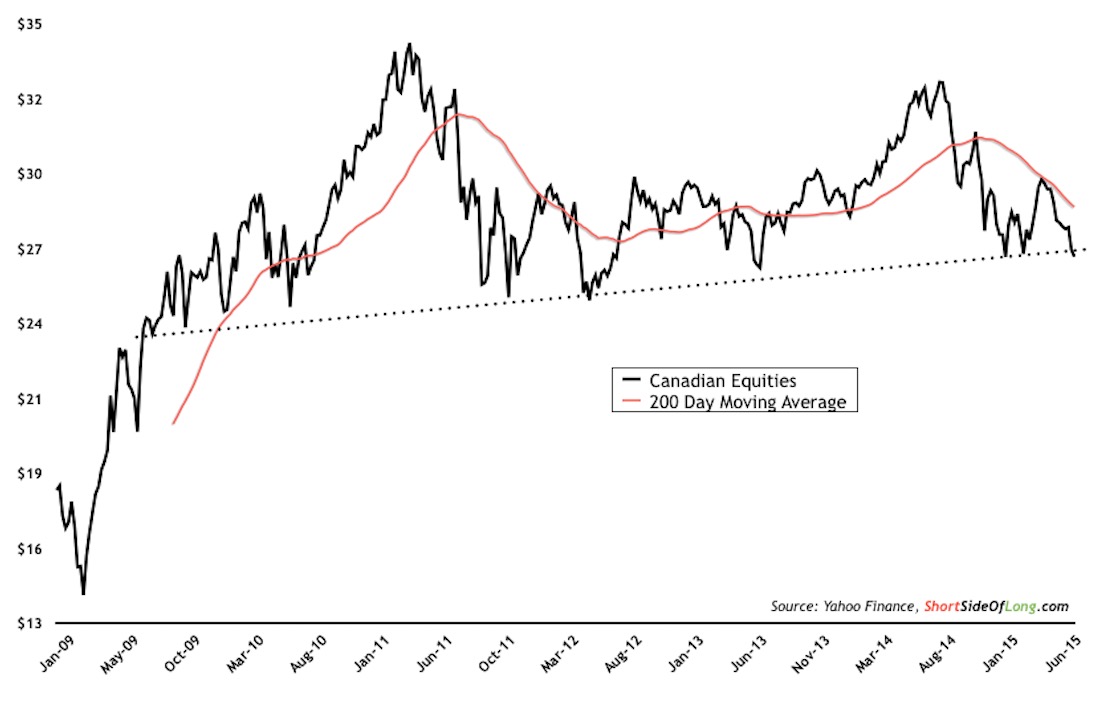
Moving along, UK and Canadian equities are sitting on support just as I write this. Australian equities have already broken down, as discussed in the recent issue of the newsletter. Emerging markets also found support in todays trading, while South Korea (major component of EM Index) has already started to break down similar to Australia.
Greek bailout will probably see majority of the stocks rebound from current support levels, while a Greek default could unravel confidence very quickly, creating some serious selling we haven't seen since 2012.
Copyright © Short Side of Long