by Ben Carlson, A Wealth of Common Sense
Many investors have been operating under the assumption that we’re due for a market crash simply because stock returns have been so high over the past five years or so. The two large crashes we’ve experienced in this century alone have turned some forecasters into the financial prognosticator equivalent of Pavlov’s dogs.
Ring the bell (high returns) and the dogs salivate (call for a market crash).
Market crashes are always possible, but they’re rare. A higher probability forecast would be that we’ll see lower returns in the future (another prediction that’s impossible to time). In theory, this one makes much more sense than a crash since periods of relative above average performance are normally followed by periods of below average performance. But nothing is a sure thing in the markets. It’s always the timing that gets you on these types of market calls.
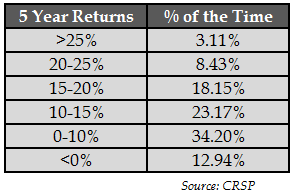
The S&P 500 is up around 16% per year over the previous 5 years. These may seem like extraordinary returns, but it’s really not out of the ordinary. Actual market returns are rarely close to the average. Here’s the performance breakdown of the entire U.S. stock market by rolling monthly periods going back to 1926:
 The average annual return over this period is 9.9%. This data shows that if you picked any month going back almost 90 years, there was around a one in five chance that 5 years later your annual returns would have been between 15-20%. A little more than one out of every ten times the market had negative annual returns over a 5 year period, about the same odds of finding returns over 20% per year.
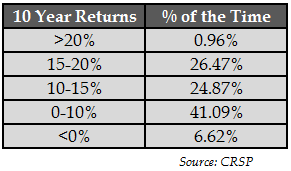
The ten year numbers are still spread out, but are more clustered that the 5 year results as the extreme gains and losses are reduced:
Of course, it’s easy to look back at the last five years and show what has happened. Things always look easy with the benefit of hindsight. The question is: What happens after we’ve experienced huge gains in the market?
Here are the 5 years returns broken out the same way as they are above, except now I’ve calculated the subsequent 5 year returns:
What this tells you is that if the previous 5 years of performance was between 15-20%, the average of the following 5 years was over 13% annually. Not really what you would expect, right? As a reference point, the average 5 year return was 9.7% annually. But it’s worth pointing out that there is a wide range of returns from the best to worst. Over any 5 year period, the results can be all over the place.
The 10 year returns show more consistency in the range of outcomes:
You can see that the worst 10 years returns are a big improvement over the worst five years returns. Surprisingly, even periods of decade-long above average performance have been followed by 9-10% annual gains on average. The average 10 year return over this time was 10.4% per year.
Based on this historical data, investors aren’t doomed to experience poor market returns going forward just because we’ve had solid performance in the recent past. Obviously, everything is circumstantial with the markets so anything is possible. That’s part of what makes investing so interesting and frustrating all at the same time. You can’t predict the future with any precision by looking exclusively at past data. There’s a caveat for every rule and market data point.
While anything is always possible, there are some patterns in these numbers that investors can use to increase their probability for success, which is the best anyone can hope for. For any long-term investor in the stock market, there are two very basic ways to improve your returns:
(1) Buy low after there’s been a market crash.
(2) Increase your holding period.
Just look at the differences in the results for the 5 and 10 year data. Nothing is promised to investors, but the range of outcomes improves substantially as the holding period increases. The probability of loss goes down. Extreme outlier events decrease.
This doesn’t mean there are no losses during these longer time frames. Nothing works all the time. There will be periods in the stock market that are frustrating because the market won’t really go anywhere or you could even lose money over decade-long stretches. These things happen, but they are completely outside of your control.
What you do control is your time horizon and time is often the most important variable to understand when making investment decisions.
Subscribe to receive email updates and my monthly newsletter by clicking here.
Follow me on Twitter: @awealthofcs
Copyright © Ben Carlson, A Wealth of Common Sense


