


Chart 1: Volume spikes during intermediate low as retail investors panic

Source: Short Side of Long
- Volume has spiked on various ETFs, including one of the most traded: iShares SPDR SPY. Usually, a spike in volume is a signal of retail investor (dumb money) liquidation and tends to signal kind of an intermediate bottom.
Chart 2: Volatility has tripled over the last few weeks… too far too fast!

Source: Stock Charts
- The same is true for the volatility index, which has tripled since middle of September. During mid week, VIX index was almost 100% above both the 50 day and 200 day moving average. Historically, this has signalled some sort of capitulation (however, sometimes only for a brief rebound).
Chart 3: High low ratio has become oversold & should signal a bounce

Source: Short Side of Long
- Bears have been in control of the current price trend, with some foreign markets under pressure since June. All of this has pushed breadth into oversold territory and the HL Ratio has now officially turned oversold for the first time since August 2011. Even during downtrends like 2008, this indicator does a great job of signalling a potential relief rally.
Chart 4: Percentage of stocks above 50 MA is also quite oversold now

Source: Short Side of Long
- Same can be said about the other breadth indicator I frequently use – percentage of stocks above a certain moving average. In this case, we look at the percentage of S&P 500 stocks trading above the 50 day moving average and come to a conclusion that we are most oversold since May of 2012 (last time we saw a 10% correction).
Chart 5: Stocks are deeply oversold relative to bonds over the short term

Source: SentimenTrader (edited by Short Side of Long)
- The Stock vs Bond Ratio indicator is very interesting (and comes to us from SentimenTrader website). While US stocks have fallen only a little bit in recent weeks, US bonds have rallied all year long and recently gone vertical. This makes stocks very attractive on relative basis. SentimenTrader reported that the last weeks Wednesday intraday movement betweens stocks and bonds got to almost 5 standard deviations oversold. Chart above shows what happens when stock bond ratio got to minus 3 standard deviations.
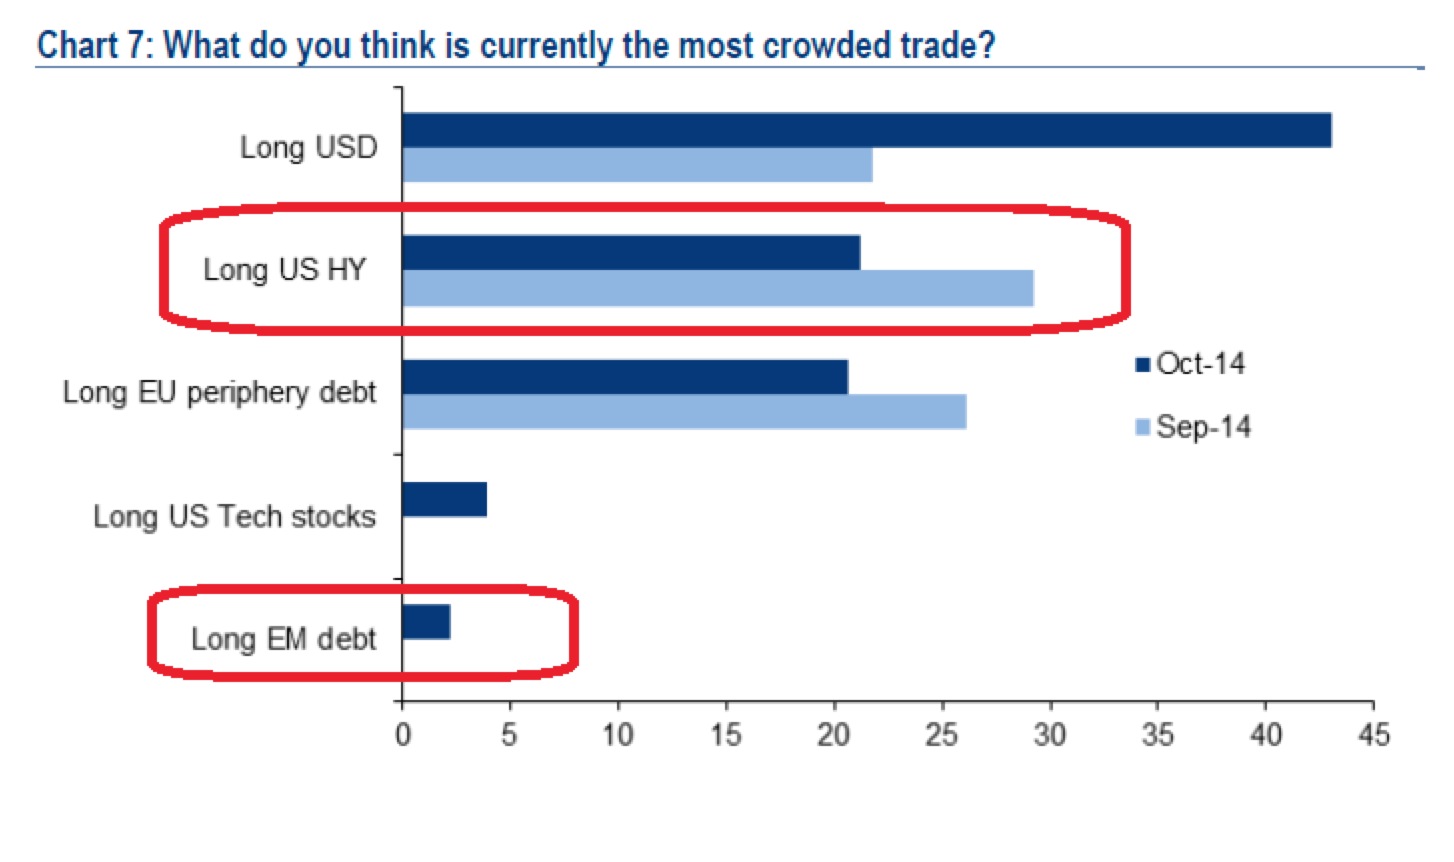
Chart 6: Some surveys have now entered fear levels & signal a rebound!

Source: Short Side of Long
- There is no real capitulation or panic yet, that is obvious. Various sentiment indicators are still either complacent or neutral. Investor Intelligence bears remain stubbornly low. However, a few indicators have entered fear levels and one of those is NAAIM. Currently, managers hold under 10% net long exposure to US equities. Last instance we saw this was around August to October 2011.
Ok that was a quick indicator recap. We discussed the short term inflection point last Wednesday, so I am not lagging here. I was very quick to point this out in real time. In the short term, bears have been squeezed a bit, with S&P 500 futures rebounding close to 1900. Still, I do not think the volatility is over and by no means has the US stock market seen a major capitulation like we went through in early 2009 and late 2011.
Now, there is no rule book to say that we have to go through something as dramatic as the repeat of those two recent crashes. On the other hand, it might even be worse this time around. The key question here is connected to underlaying conditions and fundamental developments. How well can you read them…
Has the market just overreacted to Fed ending the QE program or is there a real slowdown occurring that could drag the global economy into another recession?
If you believe that the economy is starting to slow properly and earnings to be impacted on the downside, you are probably betting on the start of a new bear market and the indicators above won’t concern you much. On the other hand, if you believe this is just a short term panic, some of the indicators here are signalling oversold conditions right now. Maybe the correction could get a bit worse (10 percent plus), but you might be willing to be a contrarian soon enough.
We will continue with Part 3 coming up next…
Copyright © Short Side of Long