by Daniel J. Loewy, AllianceBernstein
Posted by Daniel J. Loewy (pictured) and Brian T. Brugman of AllianceBernstein (NYSE: AB)
After tremendous growth over more than a decade of strong returns, risk-parity strategies have recently been struggling. Has the market run-up exposed a fatal flaw? We don’t think so.
Risk-parity strategies seek to diversify across asset classes not by concentrating on market-value exposures, but by balancing the risk contributions of the major assets to a portfolio. This strategic focus on diversification leaves risk parity structurally underweight equities and overweight other return drivers—such as bonds, credits and commodities—compared with a traditional allocation. That caused risk parity to lag in 2013, as the equity bull market strengthened and many diversifiers underperformed.
This has many investors wondering if the recent environment exposed vulnerability in risk-parity design or simply created a short-term bump in the road toward higher risk-adjusted returns. In our view, risk-parity strategies still warrant an increasing role in investors’ portfolios. We researched capital markets going back over 100 years of data (described below). This analysis highlighted a persistent benefit from risk-parity investing over investing in a traditional 60%/40% stock/bond mix. We believe that this advantage will reassert itself over time.
Our research highlights four things for investors to keep in mind when evaluating the role of risk parity in their asset allocations:
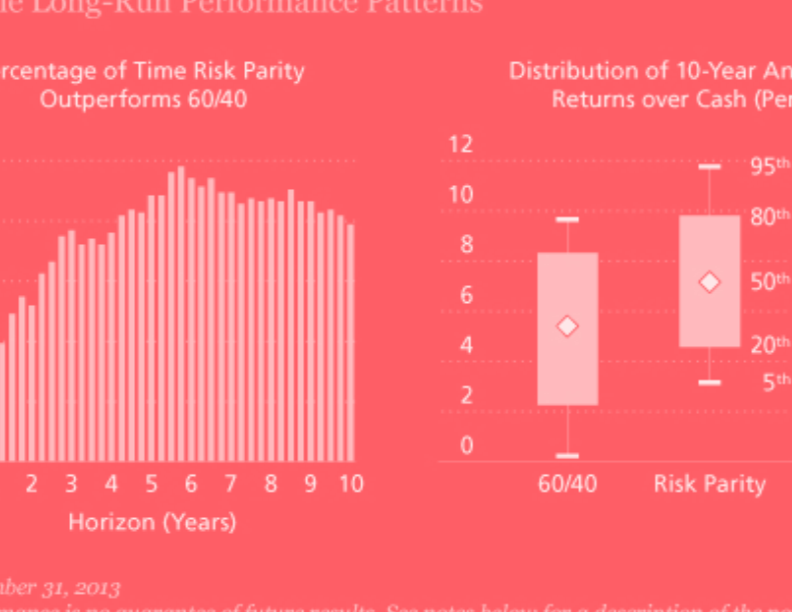
In the long run, diversification should win. Risk parity can trail a 60/40 strategy over any short period of time, particularly when stocks flourish. But the 60/40 advantage isn’t likely to last. Over individual quarters or years, risk parity outperforms 60/40 about 55% of the time. But over five-year or 10-year periods, risk parity wins more than 70% of the time (Display 1). As the time horizon grows, risk-parity performance is not only likely to be higher than 60/40 performance, but far more consistent.

For example, in 20% of the 10-year periods we studied, a 60/40 strategy failed to beat cash by 2% per year. In those cases, stocks posted poor long-run results, so the 60/40 was bound to disappoint. In contrast, risk parity, which spreads its risk across a wide range of investments, rarely posted such poor results. In fact, risk parity failed to beat cash by 2% in only 2% of the 10-year periods. So, risk parity has historically delivered higher and more reliable long-term growth.
A dynamic approach to risk parity can help. Some risk-parity strategies allocate risk equally across major asset types no matter what the market environment. The rationale is that it’s too hard to predict risk and return. We think this approach is myopic—and a mistake. Sure, it’s tough to predict future bond returns, but it seems reasonable that when Treasury yields are merely 1.6% and the yield curve is relatively flat (as was the case in mid-2013), the risk premium is likely well below normal and risk is likely negatively skewed for bondholders.
Our analysis indicates that being able to dynamically adjust the strategy’s asset allocation makes sense from both risk and return vantage points. Applying simple valuation and adaptive risk tools across asset classes has historically been a big help in generating returns and managing downside risk. A dynamic risk-parity strategy added 1.7% per year over a static risk-parity approach (Display 2). And it nearly doubled the risk-parity advantage over a 60/40 portfolio. About two-thirds of the benefit came from using dynamic risk and the rest from simple dynamic return signals. So, we think investors should consider including both in their portfolio.

We believe the timing for investing in risk parity has improved. Some investors feel that the risk-parity underperformance is still in its early stages. We disagree. By the end of 2013, bond yields had risen and yield curves had steepened. Also, commodity markets sold off and many commodity-futures curves were in “backwardation”—prices on futures contracts were lower than spot-market prices, providing an avenue for commodity futures to deliver returns. Finally, equity markets had rallied substantially and valuations no longer seemed cheap.
We think all of this bodes well for future risk-parity returns. Over the past 100 years, periods of sharp sell-offs in bonds or commodities have typically led to strong performance for risk-parity strategies, as diversifying assets cheapened and return prospects improved. On average historically, after underperforming in sell-offs, risk parity has gone on to outperform for several quarters.
Diversifying across manager strategies may improve performance. Risk parity continues to evolve as an investment approach. More managers have entered the space, and the types of strategies they employ are evolving, too. That’s a good thing: it provides more choice and potential diversification for investors. From our perspective, strategies that can be dynamic—incorporating research and manager judgment in setting risk allocations—are an important advancement.
Despite the concern over risk parity, we believe we’re looking at a bump in the road. As the risk-parity space continues to develop, we think investors should consider diversifying across a range of complementary risk-parity managers, just as they would with any other part of their allocation.
The views expressed herein do not constitute research, investment advice or trade recommendations and do not necessarily represent the views of all AllianceBernstein portfolio-management teams.
Notes on backtest: Our backtest of risk parity spans the period from December 31, 1909, to December 31, 2013, and incorporates global equities, global sovereign bonds and diversified commodity futures. All returns are quarterly. Countries include the US, UK, Japan, Germany, France, Italy, Australia and Canada. Countries are included in global equities and bonds using their nominal GDP weights as they become available. Diversified commodity futures uses a diverse basket of traded commodity futures collected by AllianceBernstein from 1910 to 1990 and from 1990 to 2013, represented by the Dow Jones-UBS Commodity Index. All risk-parity strategies are designed to deliver the same volatility as a 60/40 stock/bond portfolio over the full period. Static risk parity allocates a fixed amount of capital to each asset class to equalize their average contribution to portfolio risk over the full period. Dynamic risk parity uses simple risk and return forecasts to adjust capital and risk allocations each quarter. This backtest’s risk forecast is based on trailing asset-class returns, and its return forecasts are based on simple valuation metrics for each asset class (dividend-to-price ratio, 10-year-to-3-month slope and convenience yields, respectively). These simple dynamic tools do not represent AllianceBernstein’s actual investment process and are used to create a simple case study for illustrative purposes only. Use of different data points, assumptions, allocations and estimates might have produced varying results over time.
A bond or commodity sell-off is defined as quarterly a loss of greater than 7.8% for a four-times levered position in global bonds or 6.5% for commodity futures, which are the worst 10 percent of returns over the full period.
Data Sources: Dow Jones-UBS Commodity Index, Global Financial Data and AllianceBernstein
Daniel J. Loewy is Chief Investment Officer and Co-Head—Multi-Asset Solutions at AllianceBernstein. Brian T. Brugman is Portfolio Manager—Multi-Asset Solutions at AllianceBernstein.
Copyright © AllianceBernstein