
by Don Vialoux, TechTalk
Upcoming US Events for Today:
- Chicago Fed National Activity Index for July will be released at 8:30am. The market expects -0.10 versus -0.13 previous.
Upcoming International Events for Today:
- Japan All-Industry Activity Index for June will be released at 12:30am EST. The market expects a month-over-month decline of 0.7% versus an increase of 1.1% previous.
- German Producer Price Index for July will be released at 2:00am EST. The market expects a year-over-year increase of 0.7% versus an increase of 0.6% previous.
- Canadian Wholesale Sales for June will be released at 8:30am EST. The market expects a month-over-month decline of 0.5% versus an increase of 2.3% previous.
The Markets
Stocks ended lower on Monday, extending the present losing streak for the S&P 500 Index to four days. Losses in stocks were accompanied by continued losses in bonds as the yield on the 10-year note pushed closer to the 3.00% level. A long-term chart of the 10-year yield shows that a significant declining trendline is being tested at present levels; should yields break above this long-term trendline, a swift jump to a band of resistance around 3.75% to 4.00% appears likely, potentially pinching equity prices in the process. The bond market remains in a period of seasonal strength through October, however, Fed manipulation of the market is making gains questionable this year.

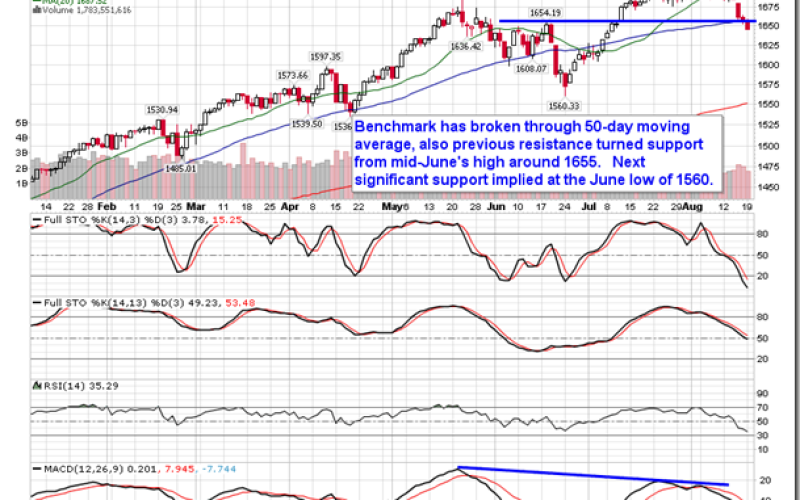
As posted over the past couple of days, 1655 was a key intermediate level for the S&P 500 due to the support implications provided by the 50-day moving average and horizontal resistance turned support at the June highs. This level was broken on Monday, opening the possibility of a retest of the June low at 1560. Declining momentum indicators and a 20-day moving average that continues to curl lower suggest downside pressures will continue, however, an oversold bounce remains in the cards at some point.

Over the last few trading sessions the number of stocks on the NYSE charting new 52-week lows has surged to 259 from a mere 5 at the start of the month. Spikes in the new 52-week lows, similar to what has been realized over the past few trading sessions, are typically accompanied by short-term lows as the market becomes oversold; higher stock prices, even if it just may be over the very short-term, are typical in the days/weeks to follow. Given that the market has yet to show signs of slowing downside momentum, this expected rebound still has a high probability of occurring from lower levels. What is critical from that point is the extent/magnitude of the rebound. Equity benchmarks have yet to chart a lower intermediate high, indicative of a negative trend. Should broad market indices, such as the S&P 500, fail to chart a higher-high within the present trend, the trend can officially be concluded to have changed. At this point, given negative seasonal tendencies, uncertain fundamental influences into the Fall, and technicals which are developing an intermediate-term negative bias, lower stock prices over the months ahead appear likely, despite any short-term rebounds that may occur.

And finally, a key gauge of risk is showing signs of faltering. Small caps have led this recent market rally, fuelling outperforming returns in the Russell 2000 Small Cap index versus the S&P 500 Index. As investors accumulate riskier assets, such as small cap stocks, equity markets in general are considered to be strong and typically trend positive as a result. The relative trend of small caps versus large caps (S&P 500 Index) has started to roll over, testing a trendline that stretches back to the middle of April. As investors enter into a risk-off mentality, market weakness is expected to follow.

Seasonal charts of companies scheduled to report earnings today:


Sentiment on Monday, as gauged by the put-call ratio, ended slightly bullish at 0.93, unchanged from the previous session. Another reading within the neutral range.

S&P 500 Index


TSE Composite


Horizons Seasonal Rotation ETF (TSX:HAC)
- Closing Market Value: $13.63 (down 0.37%)
- Closing NAV/Unit: $13.60 (down 0.31%)
Performance*
| 2013 Year-to-Date | Since Inception (Nov 19, 2009) | |
| HAC.TO | 6.92% | 36.0% |
* performance calculated on Closing NAV/Unit as provided by custodian
Click Here to learn more about the proprietary, seasonal rotation investment strategy developed by research analysts Don Vialoux, Brooke Thackray, and Jon Vialoux.

Copyright © TechTalk