July 1, 2013
by Liz Ann Sonders, Senior Vice President, Chief Investment Strategist, Charles Schwab & Co., Inc.
Key Points
- Why the June swoon occurred and why it might already be over.
- Fed's move toward policy normalization may have a lot to do with pricking perceived asset bubbles; not a more hawkish economic stance.
- Sentiment has improved notably; but technical conditions may need a bit more repair.
After a very choppy and rough ride from the end of May through the end of June, the stock market appears to finding its legs. The pullback, at this point, was limited to about 6% from peak-to-trough and the market had a nice rebound last week. Today's report will be a story-in-pictures with the latest updates on sentiment, valuation and the technical condition of the market. Our view hasn't changed. We have been in the pullback camp for a couple of months and so far, the move is in line with our expectations.
Taper tantrums
Our short-term caution was rooted in the deterioration of sentiment and some of the market's internal technical conditions. Some of that has been corrected; but we may not yet be out of the woods. The trigger for the sell-off of course was talk about the Fed beginning to taper its Treasury and mortgage-backed securities (MBS) purchases associated with quantitative easing (QE). The sharp spike in the 10-year Treasury yield led to a bout of "taper tantrums" across many of the higher-risk asset classes.
According to Birinyi Associates, stocks have now suffered their seventeenth 5%-or-more pullback since the bull market began in March 2009. The median of the previous 16 was a 7.7% decline and they took a median 20 days to come back. Of the previous 16, only two saw a decline exceeding 10%; but there were three that were just shy of that threshold.
The spike in yields, while alarming, may not mean much more turmoil in the stock market than what we already saw. As you can see in the table below, the history of major up moves in yields shows stocks actually performing quite well; save for those periods when yields were rising due to inflation problems. That is decidedly not the case at present.
Rising Yields Don't Necessarily Kill Stocks
Source: Birinyi Associates, Inc.
Economy turning back up
Our longer-term optimism has not been dented, even with the Fed on a path toward monetary policy normalization. Notwithstanding the downward revision to the very backward-looking first quarter real gross domestic product (GDP) reading, the latest economic numbers have turned up. Capital spending is picking up; the regional manufacturing surveys were generally quite strong; consumer confidence has jumped; and the housing numbers have continued their surge.
You can see the collective improvement via the Citigroup Economic Surprise Index below.
A Turn in Economic Indicators
Source: FactSet, as of June 28, 2013.
Fed sniffing bubbles
But in addition to the better economic numbers, I think the Fed is also focused on the risk of asset bubbles building. I read a great report on the subject from Jeffries' David Zervos, courtesy of John Mauldin's Outside the Box. He believes Fed Chairman Bernanke's "pronouncements appear to be a conscious effort to inject uncertainty into a fixed income market that feeds on certainty. He was taking a cue from the great Hyman Minsky. By acting against a market that had become too complacent, he was attempting to force out the dangerous and excessive leverage in the system. And while that may feel a little painful right now, we may end up being very thankful that the Committee took the actions it did … in the name of preserving future financial stability."
Zervos went on to say: "Our path to recovery does not rely on six guys and Bloomberg [terminals] leveraging up 'spready' emerging market (EM), mortgage or corporate debt. Our recovery comes from individuals taking on real investments, in real economic endeavors. Increasing the funding opportunities for companies that innovate put a real return on capital, generate real growth and create real jobs is the primary goal of QE. That is the 'portfolio balance channel' at work. And the side effects related to too much leverage in bond markets have been a thorn in the side of developed market monetary policy implementation for decades. The Fed seems to have learned this lesson and it has decided to purge some of the QE demons from the fixed income markets early, before it's too late and we have a souped-up version of 1994 on our hands."
Volatility among the risk asset classes is likely to persist as we move toward Fed tapering. But we do appear to be transitioning to a market driven more by traditional fundamentals, and less by Fed policy. So, on the subject of traditional fundamentals, a few key snapshots are detailed below
Technicals
Although the June swoon elevated some investor angst, about 90% of the S&P 500 remains in an uptrend. The next key feat by the index would be a move back above its 50-day moving average line, as seen in the chart below.
Larger Caps Clawing Back
Source: FactSet, as of June 28, 2013.
But the S&P 500 is not the entire market. The Russell 2000- the key index for small cap stocks- has a healthier technical profile; having moved nicely back above its 50-day moving average, as seen in the chart below.
Smaller Caps Doing Better
Source: FactSet, as of June 28, 2013.
The better performance by smaller cap stocks reflects their more domestic-orientation as it relates to earnings. Globally-leveraged stocks have been underperforming domestically-leveraged stocks, and we think this is a trend that will continue; although there are some indications that global growth may be troughing.
Earnings and valuation
Earnings seasons can often provide a boost to the stock market. We are in the very early stages of second quarter reporting season but it is clear that the trough in earnings estimates was hit in last year's third quarter, as you can see in the chart below.
Earnings Estimates May Have Troughed Last Year
Source: Thomson Reuters, as of June 28, 2013.
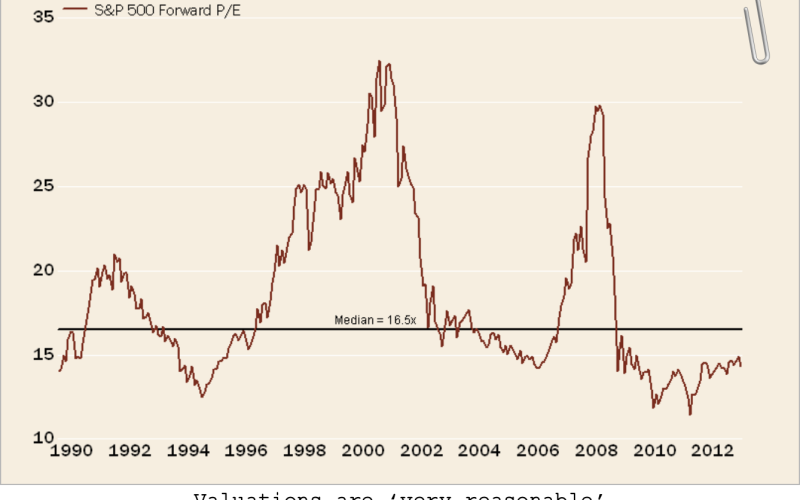
And helped by the recent pullback in stocks, valuation on forward earnings remains nicely below its long-term average, as seen below.
Very Reasonable Valuation
Source: FactSet, Standard & Poor's, as of June 28, 2013.
Sentiment
Also helped by the pullback in stocks was sentiment. I track a number of individual sentiment indices; but often highlight the Crowd Sentiment Poll by Ned Davis Research because it incorporates seven distinct measures of sentiment into one easy-to-decipher poll, seen below.
Sentiment Improvement Notable
Source: FactSet, Ned Davis Research (NDR), Inc. (Further distribution prohibited without prior permission. Copyright 2013 (c) Ned Davis Research, Inc. All rights reserved.), as of June 25, 2013.
Although the best zone for stocks is when the poll is rising from the extreme pessimism zone back into neutral, it is presently on the border of neutral and extreme pessimism; the latter a territory that is historically a healthy backdrop for stocks. This has been a nice retreat from the nearly 72% bullish reading on May 22, which was a primary trigger for us to feel a pullback was in the offing. Since then, sentiment has become more sober, and this is one of the key reasons for hope.
Important Disclosures
The information provided here is for general informational purposes only and should not be considered an individualized recommendation or personalized investment advice. The investment strategies mentioned here may not be suitable for everyone. Each investor needs to review an investment strategy for his or her own particular situation before making any investment decision.
All expressions of opinion are subject to change without notice in reaction to shifting market conditions. Data contained herein from third party providers is obtained from what are considered reliable sources. However, its accuracy, completeness or reliability cannot be guaranteed.
Examples provided are for illustrative purposes only and not intended to be reflective of results you can expect to achieve.
Copyright © Schwab.com