
by Vix and More
U.S. stocks are mostly green in today’s session, though there is a good deal of red in global stocks, notably in emerging markets, where the popular EEM emerging markets ETF is down close to 1% as I type this and the Brazil (EWZ) is down more than 2%.
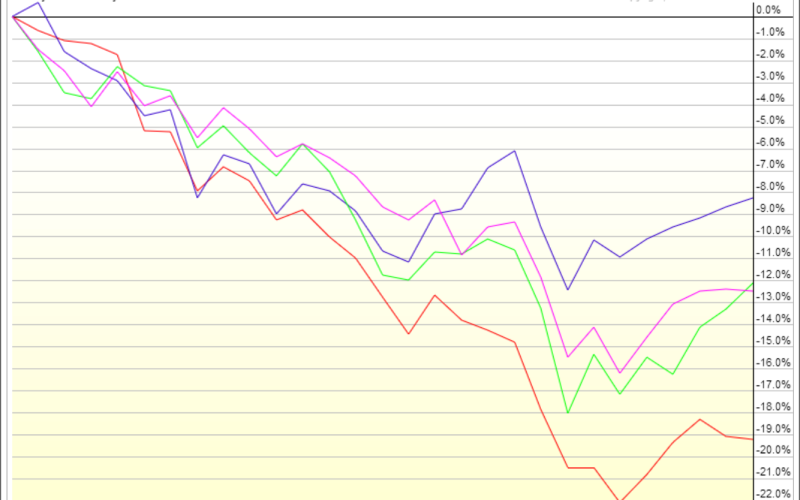
In the chart below, I plot the recent decline of the four large BRIC emerging market country ETFs: Brazil (EWZ); Russia (RSX); India (EPI); China (FXI). While all four country ETFs have declined between 8% and 20% during the past six weeks, the various woes afflicting each country appear to be country-specific to a large extent, though obviously the issues affecting China’s manufacturing base and export market have a significant upstream impact on Brazil.
Emerging markets in general have been struggling as of late, but difficulties in Brazil, India and China have helped to fuel a global selloff.
Going forward, investors will be well-served to keep an eye on all four components of the BRIC block, as well as aggregated BRIC ETFs, such as the most popular issue in this space: the iShares MSCI BRIC Index (BKF).
For those who are interested in evaluating the risk and uncertainty in emerging markets in general, the recent VEXXM as a Measure of Emerging Markets Volatility and Risk is recommended reading for some background and information on VXEEM, the CBOE Emerging Markets ETF Volatility Index.

[source(s): StockCharts.com]
Copyright © Vix and More