The Addiction to Intervention
by Alfred Lee, CFA, CMT, DMS, Vice President & Investment Strategist
BMO ETFs & Global Structured Investments, BMO Asset Management
alfred.lee@bmo.com
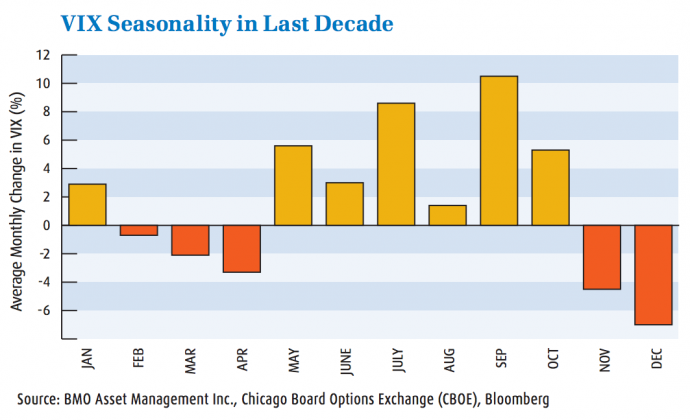
- Seemingly set to auto-pilot , following the “Sell in May and Go Away” market folklore, equity market volatility saw a substantial increase over the last two months. After seeing a massive compression in both the CBOE/S&P Implied Volatility Index (VIX)1 and the S&P/TSX 60 VIX Index (VIXC)2 over the first quarter, implied volatility levels are back on the rise, with each index gaining as much as 55.5% and 49.0%respectively since the end of April. Over the last ten years, implied volatility has shown a tendency to exhibit a large degree of seasonality.
- However, we would never make investment decisions based on seasonality alone. Themajor source ofmarket uncertainty continues to be realmacro-economic risk factors,most notably out of the Eurozone. Risk indicators, such as credit default swaps (CDS)3 on the sovereign debt of Spain and Italy in particular, are back on the rise, suggesting a greater concern over insolvency in these countries.
- Recent data has also shown that the effects of the ECB’s Long-term Refinancing Operation (LTRO)4 have been exaggerated by the market.While the program was successful in preventing a liquidity crisis in late 2011, corporate and personal lending are both down significantly, as a lack of business confidence has provided very little incentive to demand loans in the Eurozone.
- A coalition in Greece has finally been formed. Pro-bailout party New Democracy will join forces with Pasok and Democratic Left and together they will hold 179 of the 300 seats of member parliament. Their focus will now shift to renegotiating austerity terms, which creditors are looking increasingly willing to do.
- A number of Purchasing Managers’ Indices (PMI)5 for individual European countries and the Eurozone as a whole remain below 50, signifying economic contraction. The recently released Euro Area Composite PMI came in at 46.0 and has been on a five month downward trend. China’s HSBC Manufacturing PMI was last reported at 50.4, taking a very sharp fall between April and May. Closer to home, things look more promising with the U.S.’s ISM Manufacturing PMI at 53.5 and steadily trending upwards since last July.
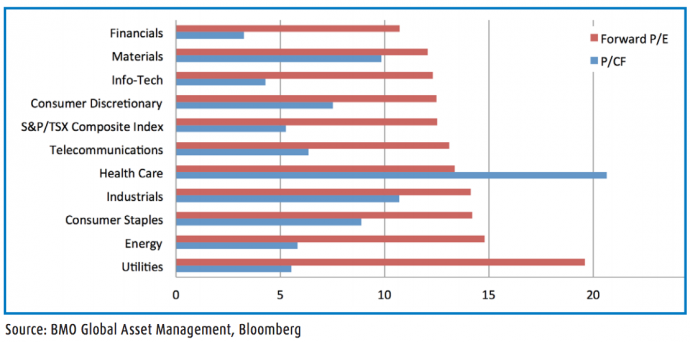
- Equity market valuations have become increasingly attractive as a result of the global macroeconomic and geo-political landscape. Currently the S&P/TSX Composite Index (S&P/TSX) has a price-to-earnings (P/E) ratio of 13.2x, while the Dow Jones Industrial Average is even lower at 12.7x. These numbers are well below their 15 year average of 20.2x and 17.8x respectively. As we have stated throughout the year, this is not a fundamentally based market, but the negative sentiment has made for a good opportunity to pick-up high quality, long-term core positions inexpensively.
Though the ride has been a turbulent one, equities and commodities have seen an enormous rally since the market bottomed “post-Lehman.” SinceMarch 9, 2009, the MSCI World Index is up 92.5%on a total return basis, whereas the S&P/GSCI Commodity Index is up 64.9%. A closer look shows that risk-assets have been largely propped up by central bank stimulus and monetary policy. Here we show two inter-market ratios (commodities vs. U.S. treasuries and Canadian equities vs. Canadian bonds) and one intra-market ratio (U.S. large-cap cyclical stocks vs. U.S. large-cap defensive stocks). Clearly, risk assets have not yet shown an ability to stand on their own two feet.
Recommendation:
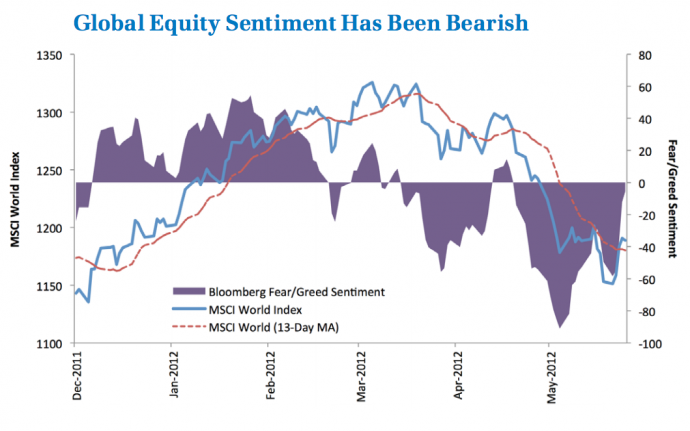
For lack of a better term, the “Risk-on, Risk-Off” behaviour of the market will likely continue, especially with central banks standing ready to inject additional stimulus into the system should markets experience considerable set-backs. As a result, the market has become far more dynamic, with frequent bouts of volatility and more changes in investor sentiment. This supports our view that investors should be tactical in their allocation amongst asset classes in this environment.
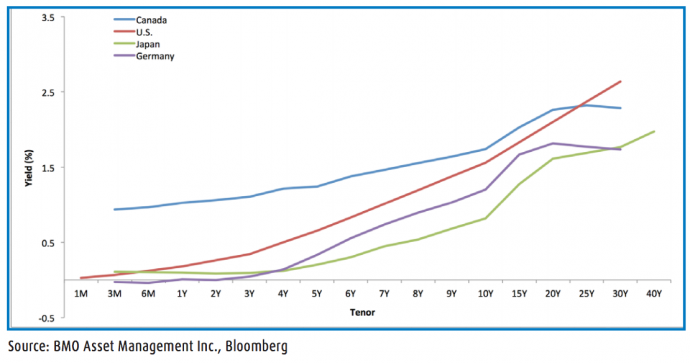
Over the last year much has been mentioned about the flattening U.S. yield curve looking eerily similar to that ofJapan’s. A closer look at a number of other sovereign yield curves, such as Germany’s and Canada’s have also shown a convergence between its shorter- and longer-dated yields. Over the last-year, the spread between 30-year and 3-month yields have fallen 31 bps and 103 bps in Germany and Canada, respectively.
Recommendation:
Although we are tactically overweight mid-term bonds, this does not suggest we are looking to completely avoid longduration bonds. In 2011, long-term Canadian federal bonds returned 19.8%and the yield curve continues to flatten with the 30-year yield down 9.3%year-to-date. However, a rally of the equity markets could place upward pressure on 30-year yields, leaving longer dated bonds vulnerable.We recommend using a broad bond ETF as a core holding and supplementing that position with more tactically positioned mid-term federal and corporate bonds.
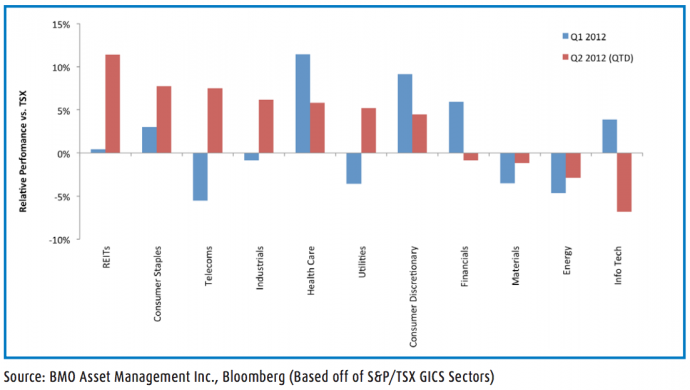
Canadian equities were quick out of the gates this year, with the S&P/ TSX gaining 6.1%in the first two months alone. SinceMarch 1, however, the “broad-based” Canadian equity index declined 8.9%, as slower growth expectations out of Europe and China have become a drag on the economically sensitive, commodity related sectors. The high concentration of material and energy related stocks in the S&P/ TSX have overshadowed the strong performance of other S&P/ TSX sectors over the quarter, causing many investors to miss out on returns.
Recommendation:
The high exposure to resources in the S&P/ TSX has served investors well over the last decade during the commodity super-cycle. Given the lack of clarity in the Eurozone and increasing signs of economic contraction in China, commodity related stocks could potentially face increased volatility. Recently the Canadian VIX (VIXC) rose above its more commonly quoted U.S. counterpart, the VIX.We are therefore, utilizing the BMO Low Volatility Canadian Equity ETF (ZLB) as a way to reduce volatility while staying invested in Canadian equities and also obtaining exposure to less economically sensitive areas.
Changes to the Portfolio Strategy:
Asset Allocation:
- We are establishing our strategy with a slight overweight in risk assets. Although the macro-economic backdrop remains bleak, fundamentals are rarely attractive without potential risks. To mitigate risk in the overall strategy, we are decreasing beta in our equity exposure, to off-set our higher weight in corporate bonds. Additionally, we are utilizing U.S. high yield bonds and emerging market debt as a less volatile substitute to U.S. corporate and emerging market exposure.
Fixed Income
- Our fixed income strategy is to implement a core-satellite approach. The BMO Aggregate Bond Index ETF (ZAG) will provide us with broad-based exposure to Canadian bonds, while we use more sector specific bond ETFs to fine tune our fixed income exposure. Although long-duration bonds offer higher potential returns, they do come with more volatility and interest rate sensitivity. As we see a low probability of the Bank of Canada (BoC) hiking interest rates this year, we recommend mid-term federal and corporate bonds in the Canadian fixed income space. Thus we are utilizing the BMO Mid-Federal Bond Index ETF (ZFM) and the BMO Mid-Corporate Bond Index ETF (ZCM) to gain exposure to these areas.
Equities:
- For core Canadian equity exposure we are utilizing the BMO Low Volatility Canadian Equity ETF (ZLB) and BMO Canadian Dividend ETF (ZDV)to gain exposure to lower beta and dividend paying equities, respectively. According to our Global Index TrendSpotter Model, low beta and dividends are two factors that have been effective in the last two quarters. Given the heightened volatility over the last two months and less upward pressure on interest rates, we believe these two factors will continue to fare well in the third quarter.
- Over the last 18 months we have favoured U.S. equities, which has been a call that has paid off. Despite a number of unnerving data points recently, we continue to recommend a significant allocation to U.S. stocks, particularly in the multinational space. As implied volatility levels have risen, we recommend using the BMO Covered Call Dow Jones Industrial Average Hedged to CAD ETF (ZWU) as a way to enhance yield and reduce volatility while maintaining exposure to U.S. blue-chip companies.
- One concern we have formultinationals is a higher U.S. dollar. Thus, we are also tactically positioning some of our U.S. equity exposure in the BMO U.S. Equity Index ETF (ZUE)in order to get exposure to somemid-cap U.S. companies. Thesemore locally based companies should benefit froma higher U.S. dollarmore so than multinationals. Additionally, we have established a small position in the BMO Nasdaq-100 Hedged to CAD Index ETF (ZQQ)to gain exposure to U.S. technology and consumer discretionary companies, based on their sensitivity to U.S. consumer confidence which has been on the rise.
- Other notable positions include Canadian banks and large-cap energy companies. We believe the recent sell-off has led to attractive valuations in those areas. Though macro-related issues could lead those sectors to become increasingly more inexpensive, we believe positions in these high quality areas can be established as long-term positions on the low. The BMO Covered Call Banks ETF (ZWB) allows us to get exposure to the big-six Canadian banks, while enhancing yield and lowering volatility, and the BMO Equal Weight Oil and Gas Index ETF (ZEO) provides exposure to larger cap energy related names.
- Additionally, we continue to believe the current low interest rate and sufficiently strong business environment in Canada will be favourable for real estate investment trusts (REITs). We are therefore establishing a tactical position in the BMO Equal Weight REITs Index ETF (ZRE) to attain exposure to Canadian REITs.
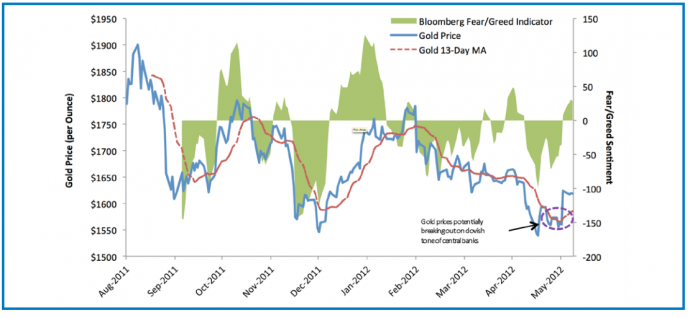
- Central banks look increasingly willing to take a dovish stance in monetary policy and provide further stimulus if needed. The Euro/ USD cross continues to break-down technically and there are talks that the central banks of emerging markets are now selling their Euro reserves. Increased macro-economic uncertainty and continued currency wars will also be a positive for gold. Momentum indicators also show gold bullion recently turning up consistent with the trend that gold tends to strengthen in the mid-summer.We are utilizing our BMO Precious Metals Commodity Index ETF (ZCP)to gain exposure to gold and silver prices.
click image below to enlarge
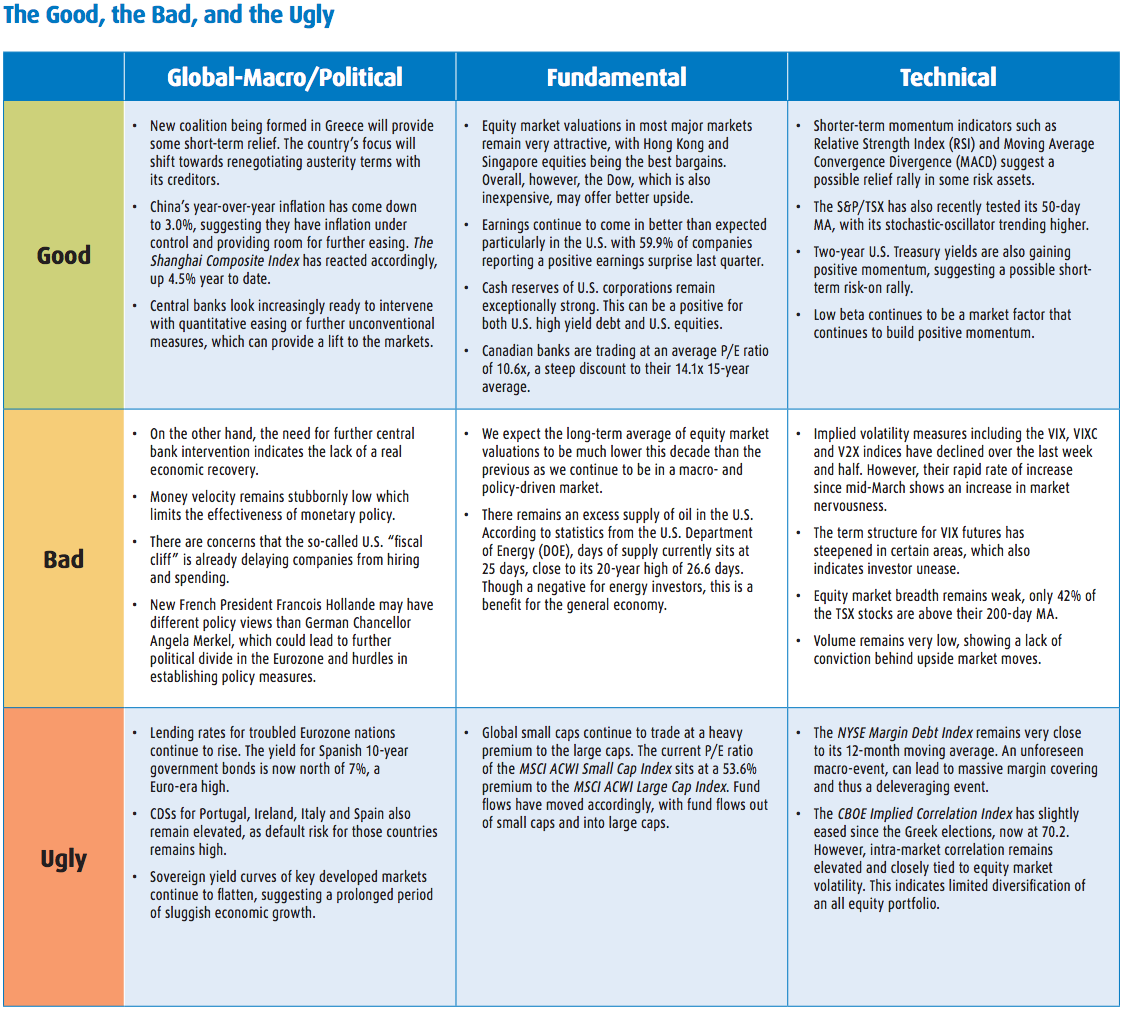
Conclusion: News of the New Democracy party leading a coalition in Greece likely shifts the country’s focus to renegotiating its austerity terms. Although Greece’s creditors look willing, the situation is far from over. On a global basis, there is still chance for disappointment if further central bank intervention does not occur or falls short of current investor expectations. Some shorter term indicators look slightly more positive, with some emerging markets starting to ease monetary policy again. Attractive valuations should also bring bargain hunters back into the market. However, volume levels remain low, showing a lack of investor conviction. Over the secular period, the macro-economic story continues to dominate and the outlook lacks clarity.We continue to believe we are in a multi-period holding pattern, which leads us to conclude that investors should dedicate a significant portion of their portfolio to tactical positions.
Footnotes:
1 CBOE/S&P 500 Implied Volatility Index (VIX): shows the market’s expectation of 30-day volatility, annualized. It is constructed using the implied volatilities of a wide range of S&P 500 index constituent options. This volatility is meant to be forward looking and is calculated from both calls and puts. The VIX is a widely used measure of market risk and is often referred to as the “investor fear gauge”.
2 S&P/TSX 60 VIX Index (VIXC): the Canadian equity market equivalent of the VIX to show the market’s expectation of 30-day volatility, annualized. This index is used as a gauge for investor sentiment on Canadian large-cap stocks.
3 Credit Default Swaps (CDS): A swap agreement where the seller of the CDS will compensate the buyer in the event of a loan default or other credit event. The buyer of a credit default swap receives credit protection, whereas the seller of the swap guarantees the credit worthiness of the debt security. In doing so, the risk of default is transferred from the holder of the fixed income security to the seller of the swap. As such, a rising CDS price indicates an increasing probability of a default on a fixed income issue, while a declining price indicates a lower probability.
4 Long-Term Refinancing Operations (LTRO): a major financing method used by the European Central Bank to provide liquidity to its member banks. Although the operation has been in existence for well over a decade, its rules were recently revised to make it considerably easier for banks to obtain funding. First, through LTRO banks can now post collateral to borrow funds for three years rather than several months. Second, the eligible collateral to obtain funding has been relaxed significantly.
5 Purchasing Managers’ Index (PMI) is an economic indicator on the financial activity reflecting purchasing managers’ acquisition of goods and services. Data is for the PMI are compiled by monthly surveys polling businesses that represent the make up of the respective sector. The surveys cover private sector companies, but not the public sector. A number above 50 indicates economic expansion, whereas a number below 50 suggests economic contraction.


