


SIA Weekly: Technical Oultook for USDCAD and Crude Oil
In this week’s edition of the SIA Equity Leaders Weekly, we are going to revisit the USDCAD currency relationship as well as give an update on a key commodity, Crude Oil and its weakness of late. Crude Oil is commonly referred to as a “petro” dollar because typically we have seen some inverse correlation movement, if the USD strengthens, the price of Crude weakens and vice versa. So we will take a closer look at each relationship in more detail below.
United States Dollar/Canadian Dollar (USDCAD)
The last time we looked at the USDCAD comparison chart was on the June 16 edition of the Equity Leaders Weekly. Many significant events have transpired since that time such as the Brexit referendum. As we all know, the direction of the US dollar will largely be dependent on which direction the US Federal Reserve takes on it’s interest rate policy. The Fed, for several months, have been weighing the merits of when to increase interest rates based on not only what has been happening within its own economic front but also what has been occurring on an economic front worldwide. The Fed has continually taken a “cautious” approach with regards to interest rates hikes with the world economy still in a rather vulnerable state but all the while still considering what economic data has been materializing within its borders. This “cautious” approach has caused the USD to weaken since the beginning of the year. With the Brexit outcome, many believe this will have an adverse effect on global growth. However, recent positive economic data coming out of the US of late, has re-enforced the belief the US economy is on a stable path to steady economic growth. Some of the recent positive economic growth numbers include US retail sales rising 0.6% in June making this the third consecutive month of gains. The ISM also reported that its closely watched manufacturing index expanded for a fourth month in a row to 53.2 in June, up from 51.3 in May. With better economic data coming out of the US, it may give a bit more ammunition for the prospects of a Federal reserve interest rate hike later this year which may result in the strengthening of the USD. Even recent economic news out of China has shown their economy increased slightly stronger than the expected 6.7% in the second quarter. It will be interesting to see going forward if the Brexit outcome will have enough of an impact to offset the continued US expansion and force the US Fed to hold off on any interest rate hikes moving forward.
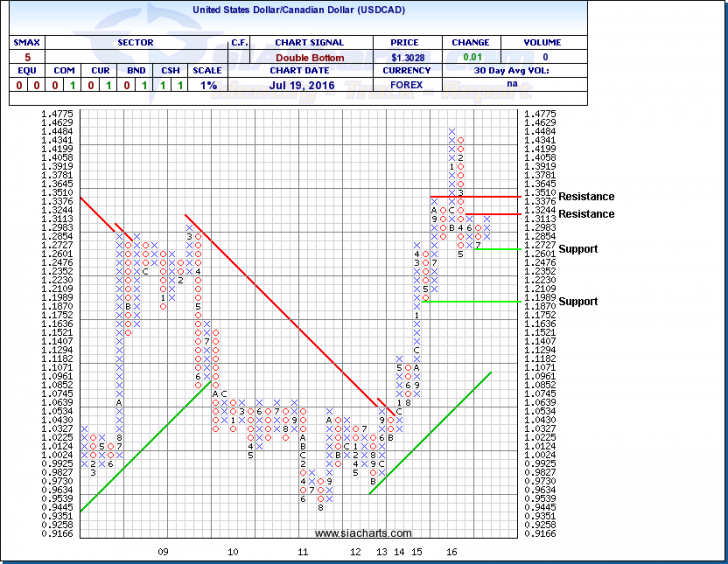
In looking at the attached USD/CAD comparison chart, we see that USD has strengthened perhaps as a result of the recent positive US economic data. The chart has now moved into a rising column of X’s after holding its previous key support level of 1.2476. The USD dollar is now quickly approaching its near-term resistance level of 1.3244. If it can manage to break above this resistance level, the next level of resistance is at 1.3510. Support is now at the 1.2601 level and, below that, the 1.1870 area. It will be interesting to see if the USDCAD continues in its tight trading range these last few months or if there will be any resolve to either the upside or downside. The US Federal Reserve interest policy may have impact on which direction the USD will take. The VS SMAX score shows the comparison chart is in a virtual tie with a score of 5.
Click on Image to Enlarge
Crude Oil Continuous Contract (CL.F)
The last time we looked at the chart of Crude Oil (CL.F) was in the May 19 edition of the SIA Equity Leaders Weekly. Since that time we have seen a fair bit of change materialize in the price of crude. The crude oil market experienced supply disruptions earlier this spring due to the Alberta Wildfires as well as the pipeline attacks in Nigeria. This had a positive impact of the price of crude oil. Most recently, a protest over wages has forced a shut down at an oil terminal in Eastern Libya which will result is a suspension of 100,000 barrels of oil per day. The latest US crude inventory numbers have shown inventories fell 2.3 MM barrels last week marking the ninth week in a row of declining US stockpiles. These numbers could be attributed to these supply disruptions in Alberta and Nigeria as well as a decrease in US shale production. However, supply disruptions that we have seen in Alberta and Nigeria are only temporary in nature. The global oil supply glut is still intact and the supply-demand rebalancing in the oil market is not expected until later in 2017. As such, we have seen the price of crude oil have trouble breaking above the psychological $50 resistance level and a pullback has ensued since then.
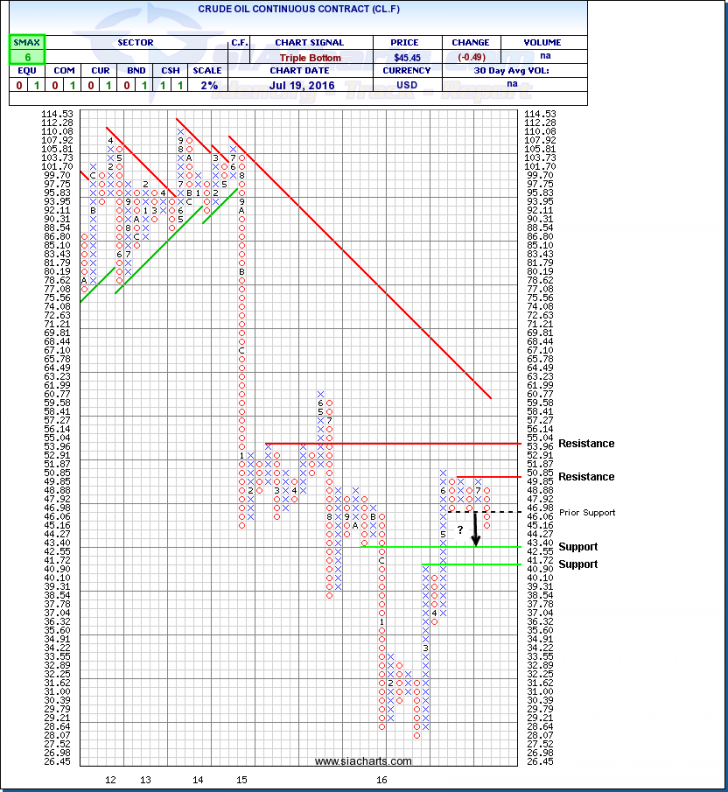
In looking at the chart of CL.F, it has recently broken a prior support level at $46.06. Support can now be found at $42.55 and, below that, the $40.90 level. If any strength materializes in Oil, resistance is at $50.85, and above that, the $55 level. With an SMAX score of 6, CL.F is still showing some weak near-term. It will be interesting to see going forward it crude oil will continue to pullback given its inverse relationship to the USD that we have seen sometimes affect each other in the past.
Click on Image to Enlarge
SIACharts.com specifically represents that it does not give investment advice or advocate the purchase or sale of any security or investment. None of the information contained in this website or document constitutes an offer to sell or the solicitation of an offer to buy any security or other investment or an offer to provide investment services of any kind. Neither SIACharts.com (FundCharts Inc.) nor its third party content providers shall be liable for any errors, inaccuracies or delays in content, or for any actions taken in reliance thereon.
For a more in-depth analysis on the relative strength of the equity markets, bonds, commodities, currencies, etc. or for more information on SIACharts.com, you can contact our customer support at 1-877-668-1332 or at siateam@siacharts.com.