by Jeffrey Saut, Chief Investment Strategist, Raymond James
On CNBC last Friday, we stated that we have been in a stealth bull market. Indeed, after anticipating the stock market’s bottom in early February, the stealth bull market emerged. So what’s a stealth bull market? Well, while the major market indices are marginally better year-to-date (YTD), many of the other indices are up double digits. For example, the D-J Industrial Average is up some 1.21% YTD, while the S&P Small Cap 600 is up 11.70%, the NASDAQ Composite has rallied 13.36%, the NASDAQ 100 +15.31%, well you get the idea. Moreover, many of those indices have tagged new all-time highs, as have most of the Advance/Decline Lines. As our friend Leon Tuey writes:
Those who are waiting for "clarity" have already "missed the boat" and when the major market indices hit new highs, no doubt, they will be complaining that the market is too high or that it is overvalued. . . . The market's resiliency is not surprising. The market is telling investors that a "Trade War" is unlikely. What is behind the market's strength is improving earnings momentum. Also, as mentioned in my recent reports, sentiment backdrop is ideal as fear is universal. Everyone is frothing at the mouth about the "Trade War." Moreover, the supply/demand condition is bullish. This year, corporate share buybacks reached a record. Meanwhile, investors continue to reduce equity holdings. The dummies are selling, but the smart/informed investors are buying.
Further, there is the chance we have entered a “buying stampede.” Recall that buying stampedes typically last 17-25 sessions, with only one- to three-session pauses/pullbacks, before they exhaust themselves on the upside. It appears to be the rhythm of the thing in that it takes that long to get everybody bullish enough to throw in the towel and “buy ‘em” just in time for a trading top to arrive. While it is true some stampedes have lasted 25-30 sessions, it is rare for one to go more than 30 sessions. If this is such a stampede, today is session 11.
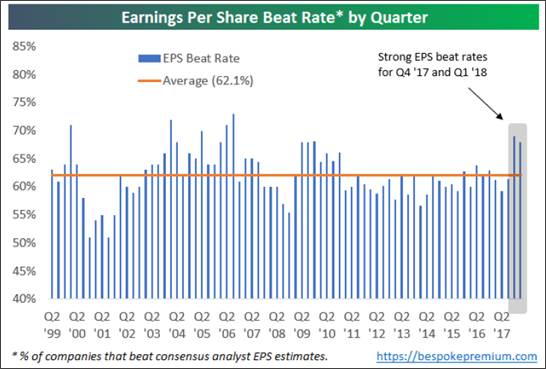
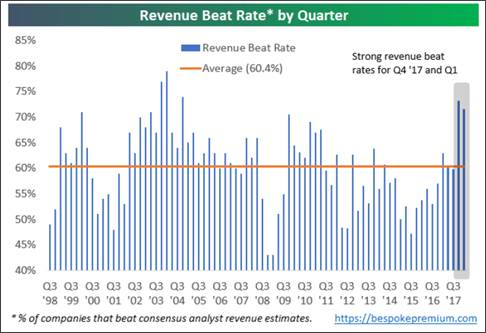
Meanwhile, we have entered earnings season, and my conversation on CNBC turned to the financials and why they are not responding to good earnings. We said that too many investors are paying attention to the yield curve thinking the financials are not going to do very well until the yield curve steepens. We also stated there are financials and then there are financials. While it is true the large cap banks have stalled out, the brokerage stocks have done pretty darn well. Likewise, the small cap banks have done well. This small bank stock performance is reflected in David Ellison’s Hennessy Small Cap Financial Fund as well as Anton Schultz’s RMB Mendon Financial Services Fund. Speaking more to this earnings season, over previous quarterly earnings reports, earnings have tended to come in better than most expected. We do not think it will be any different this time. In fact, consensus estimates suggest that there will ~20% earnings growth over the next four quarters. One credible service is actually forecasting $200 in earnings for the S&P 500 in 2020. If that is anywhere near the mark, it implies the S&P 500 (SPX/2801.31) is trading at 14x 2020’s earnings estimate. Using this year’s estimate (~$158) yields a price to earnings (P/E) ratio of 17.7x, while using next year’s (~$174) produces a P/E of ~16x. And, it is not only earnings that are soaring, but revenue growth has kicked in, as well (charts 1 and 2 on page 2).
Moving on to some of last week’s economic reports, our friend Joe Brusuelas (Chief Economist of RSM) had this to say:
While, the labor market remains historically tight the pace of U.S. inflation is now outpacing wage gains late in the business cycle. Inflation on a year ago basis is up 2.9 percent compared with the 2.7 percent gain in average hourly earnings amidst no gain in real average hourly earnings over the past year. Given that the U.S. is now ensnared in a three front trade war which will in the near to medium term result in higher prices policymakers at the Fed are likely to find themselves in quite the dilemma in early 2019 when its rate policy will reach a point when it becomes restrictive as the impact of the trade conflict bites and prices increase. Investors and firm managers should brace themselves for rising prices, reduced purchasing power, and a loss of competitiveness due to explicit policy choices in Washington and an economy growing well above trend (chart 3 on page 4).
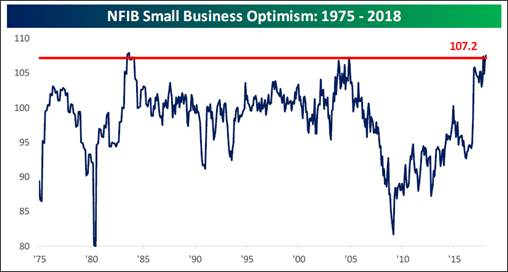
Clearly, the U.S. economy is hitting on all cylinders and business optimism, for whatever reason, is leaping (chart 4 on page 4); business is good. We will get more news on the economy this week, for as our economist, Scott Brown Ph.D., writes:
This Week - There may be some market reaction if we get a surprise in the retail sales report, but the focus is going to be on Fed Chair Powell's monetary policy testimony to the Senate Banking Committee (Tuesday). Powell's written testimony will be released an hour and a half before the hearing begins, but there's always a chance that something will come up in the Q&A. Powell will repeat his testimony to the House Financial Services Committee on Wednesday.
Returning to the subject of the stock market’s action last week, we found the always insightful Lowry’s Research Organization’s weekend notes particularly interesting. To wit:
So, how do these deteriorating market conditions compare with conditions today? Actually, they don’t. But, they do contrast from today’s market. For example, rather than deteriorating, market breadth continues to expand, with both the NYSE all-issues and our Operating Companies Only (OCO) Adv-Dec Lines reaching new all-time highs this week. And, expanding breadth is apparent in all three market segments, as the S&P and OCO Large, Mid and Small Cap Adv-Dec Lines each recorded a new all-time high this week. Supply and Demand trends today also offer contrasts, as Buying Power remains in a long-term uptrend, climbing to within four points of its March rally high this week, while Selling Pressure fell to lows last seen over 70 years ago. In addition, the percentage spread between the Buying Power and Selling Pressure Indexes reached its most positive level since 2004 this week.
The call for this week: Believe it or not, the McClellan Oscillator is not overbought despite last week’s rally. And as Barron’s wrote in today’s edition:
If history is any guide, the stock market should have a decent 2018 second half. Research outfit Bespoke Investment Group ran a correlation of the closing prices – through July 11, of the S&P 500 to every year since 1928. Statistically, just two years correlated strongly with 2018: 1942 and 1980, when the rest of the year was up 11% and 15%, respectively.
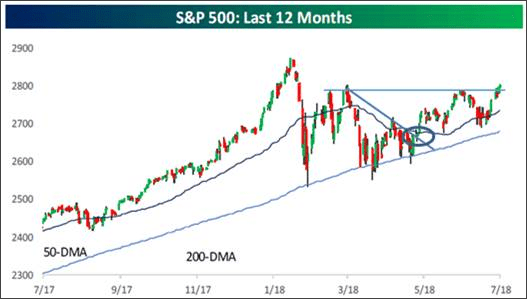
Also, according to uber-smart Nick Colas (DataTrek Research), “We went from a market where everything moved largely together to one where sector fundamentals began to matter more than where the S&P 500 was going.” And boy, do we agree with that! It is also consistent with our now over 18-month theme that we have returned to a stock-pickers market where active management should be favored over passive (indexing) investing. Also worth mention is what we have stated since mid-2015: the equity markets have transitioned from an interest rate-driven to an earnings-driven secular bull market. Indeed, this should be the 26th consecutive quarter where earnings reports exceed the estimates. And that, dear reader, is why the SPX surmounted the overhead resistance at the 2792/2795 level and is in the process of doing the same thing at the 2800/2805 resistance level. We were cautious in late January, since our models were calling for a February Flop. Subsequently, those same models called the undercut low of February 9, which we termed to be THE LOW, and have been bullish ever since, thinking the markets were going to trade-out to new all-time highs – many have done so – so, can the SPX and Dow be very far behind?! If you are looking for a list of stocks to buy, in addition to those mentioned in these reports, peruse this week’s Barron’s, and the front page headline, “Our Experts Return With 34 Investment Ideas,” many of which are favorably rated by our Raymond James’ fundamental analysts, or consider the Raymond James Analyst’s Best Picks List, which is outperforming the S&P 500 YTD. The long-term tale of the market was told when the SPX broke out above the triangle chart formation, which we repeatedly wrote about, on May 10 (chart 5 on page 5), suggesting the secular bull market is alive and still well. We suggest investing accordingly. This morning, participants should play for the usual Monday rally and the expected rally for this expiration week. However, astute traders must wonder if much of the expiry week rally occurred last week on front running of the earnings reporting season. The DJIA closed 19 points above 25k, while the S&P 500 Index closed at 2801.31. Therefore, the game should be to keep these indices above those psychological key threshold trading levels of 25000 and 2800, respectively. This morning, as we write at 5:07, the preopening S&P 500 futures are better by some 2 points as China’s 2Q GDP growth softens on slowing economic trade growth and France wins the World Cup.

*****