
October 10, 2017
Market Ethos: Financial Gravity
by Craig Basinger, CFA, Connected Wealth, RichardsonGMP
After the apple hit Sir Isaac Newton’s noggin, he, and subsequently the rest of the world, understood gravity – what goes up must come down. There is also a form of gravity in the financial markets, which often goes by the adage ‘mean reversion’. While it may not be as strong as the physics version of gravity, nor as consistent (physics gravity is relentless), the financial markets often experience a pretty strong mean reversion. Not just what goes up often comes back down but what goes down can often come back up, at least somewhat. This appears to be especially acute after extremes in one direction or the other and appears to be evident in share prices, earnings and economic data. In this report we are going to focus on share prices.
Mean reversion (or our new name, Financial Gravity) appears to be most acute after sudden and material moves in share prices. This has important implications for investors. As often can be the case, when a stock is moving fast, there is a heightened desire to act. This can be to bail on the downside, as the drop hits a pain threshold or rush to join in the upside, not wanting to miss out any longer. Based on our analysis, we would argue for not making a ‘knee jerk’ reaction or sudden move, as big moves often tend to mean revert in the short term.
What we did
Using the S&P 100 constituent members we measured three-day price changes over the past five years. An extreme move was measured as a three-day move that was at least two standard deviations outside the norm for the company over the past year, either on the high or the low side. We then measured the subsequent share price move over three, five and ten days. In each combination we calculated the average, median price return and the percentage of instances that were positive.
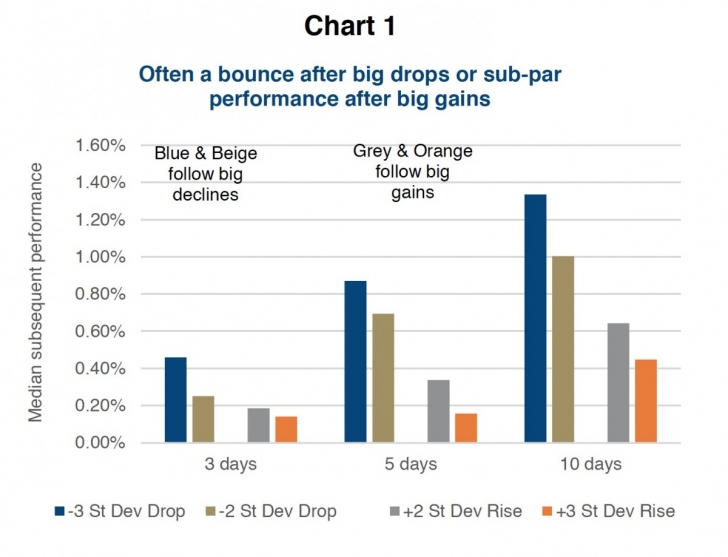
Chart 1 shows the median performance after a share price decline or rise that was in excess of two or three standard deviations. There is clearly a relationship that returns appear more substantial following a big drop (blue bars). Conversely, gains appear muted following a big share price gain (orange bars). To put these values into perspective, the median performance for the entire universe is +0.18%, +0.30% and +0.56% for three days, five days and ten days respectively landing in between negative and positive deviations.
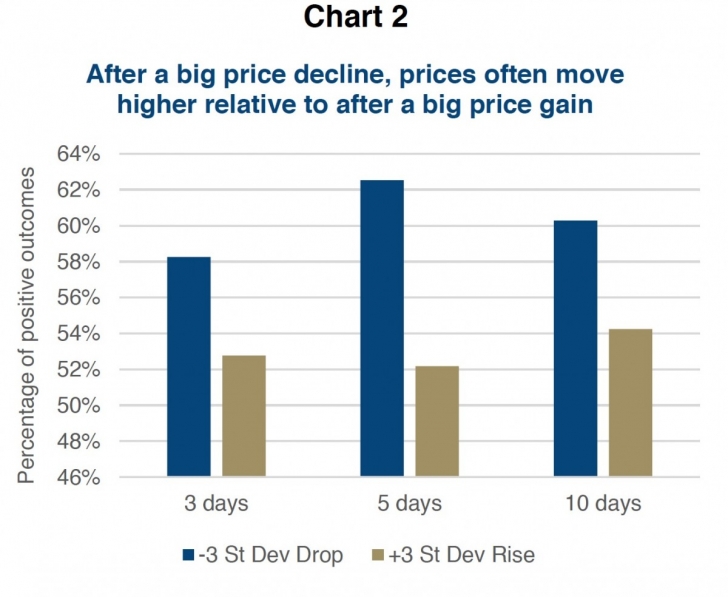
Chart 2 shows the probability of a move higher in price following either a big price decline or a big price gain. Again, after a decline there is a higher probability of a price rebound compared to after a big price gain.
Why - Markets overreact to surprises
In the short term, it would be clear that markets tend to overreact to surprise news. In this analysis we did not differentiate given the cause of the original price move. Many of these, both positive or negative, are attributable to an earnings surprise or surprise news event. Based on the analysis, it would appear that prices tend to overreact to whatever the news was and subsequently mean revert. This trend does appear to be more reliable following price declines.
Investment implication
Investors, us humans, tend to overreact to surprises in the market for a given company. It would appear that following a positive surprise and move higher in a stock’s share price over a three-day period, subsequent near term return expectations should be muted. Conversely, following a sudden decline, for whatever reason, share prices more often see a degree of rebounding. This is all mean reversion, or if you prefer ‘financial gravity’ back towards the previous trend. As a result, investors should not try and chase near term returns after a sudden jump. And following a sudden sell-off, may want to reconsider bailing, waiting for a potential short term partial rebound.
Note to Readers
Behavioural Finance combines behavioural and cognitive psychology theory with conventional economics and finance. Essentially it attempts to account or add the “human” element into understanding how the markets behave. While still a relative new area, it has garnered a rising amount of attention. The most common aspects of this discipline are behavioural biases, such as loss aversion, framing, overconfidence, anchoring, recency bias, overreaction, etc. Many publications are devoted to helping investors understanding these biases to avoid their negative impact on performance. We will be starting an investor speaker series later this fall devoted to helping investors better manage their inherent biases, with the goal to make our clients better investors. Stay tuned.
At Connected Wealth we are also taking this one step further. The team is currently researching not only the various biases in the real world but working on investment strategies that take advantage of these biases. In the coming months, we will be publishing on various aspects of this work, and we welcome any feedback.
*****
Charts are sourced to Bloomberg unless otherwise noted. This material is provided for general information and is not to be construed as an offer or solicitation for the sale or purchase of securities mentioned herein. Past performance may not be repeated. Every effort has been made to compile this material from reliable sources however no warranty can be made as to its accuracy or completeness. Before acting on any of the above, please seek individual financial advice based on your personal circumstances. However, neither the author nor Richardson GMP Limited makes any representation or warranty, expressed or implied, in respect thereof, or takes any responsibility for any errors or omissions which may be contained herein or accepts any liability whatsoever for any loss arising from any use or reliance on this report or its contents. Richardson GMP Limited is a member of Canadian Investor Protection Fund. Richardson is a trade-mark of James Richardson & Sons, Limited. GMP is a registered trade-mark of GMP Securities L.P. Both used under license by Richardson GMP Limited.
Copyright © Connected Wealth, RichardsonGMP