
by Ben Inker, GMO LLC
Emerging Value and Margin of Superiority
Why would a value manager buy more of an asset that has just gone up?
Long-time GMO clients have become accustomed to a certain kind of behavior from our asset allocation portfolios. If they are reading stories about how well an asset class has been doing, chances are pretty good that their next account statement will show that we are a seller of that asset (assuming we owned some in the first place). If, on the other hand, headlines are about how horribly things are going for an asset class, our clients have come to expect to see us buying in the coming quarters. But recently we made a move across a number of our asset allocation portfolios that goes counter to that general pattern.
After a strong first half of 2017 for emerging equities that saw them rise over 18%, we actually bought more emerging in early July. It seems like a non-intuitive move for us to make, but we believe it is the correct one despite the fact that the prospective returns to emerging equities have dropped a bit since the beginning of the year. Even though the absolute expected return for emerging market value stocks has decreased, we believe the margin of superiority of emerging value over other assets has actually increased. As its superiority is higher and emerging-specific risk is relatively benign, our willingness to bear its risk has increased at the margin, which created the opportunity for us to increase our allocation. Emerging value is extraordinary today
There are a couple of important points to make about our decision to buy more emerging recently. The first is that despite the strong returns of emerging equities so far this year, the group we are most interested in, emerging value, hasn’t been particularly extraordinary. MSCI Emerging is indeed up over 18% through the first half of the year, but value has underperformed by 4.8% in the period and 3.5% of the returns to emerging were due to currency moves. That leaves emerging value up about 10% in local terms, about on par with stocks around the world. Given that fair value for the group compounds at around 6% real annually or 3% in a half year, this means emerging value should have gotten about 6% more expensive over the period, which would cause its forecast to drop by around 0.8%, all else equal.1 In this particular period, all else has been more or less equal and the forecast has indeed gone down by 0.8%, from 7% to 6.2%. Our next favorite equity assets, EAFE value and US quality, have seen their forecasts fall by 0.3% and 1.1%, respectively.
But the second point to make is that we have tried to learn the lessons of history with regard to how to use value to actually outperform. As I wrote a few years ago in “Divesting when Discomfited” and touched again on last year in “Keeping the Faith,” one of the key aspects of value as a selection technique is that lagged value works every bit as well as – and sometimes better than – today’s value. As a result, when putting together our portfolios we react not just to today’s forecast but to the average of the forecasts over the last year. And on this basis, emerging value has done something fairly remarkable. Emerging value today is not the cheapest we have ever seen it; not only was it cheaper at the beginning of the year and at some points in 2016, but it was significantly cheaper than today in both the financial crisis and the 2002-03 period. Actually, in February 2009, almost every single risky asset class we had a forecast for had a higher forecast than emerging value does today!2 But, on a measure that really matters to us for portfolio construction, emerging value today is the best asset we have ever seen. That measure is its “margin of superiority” – the amount by which it is better than the next best asset on our forecasts.3
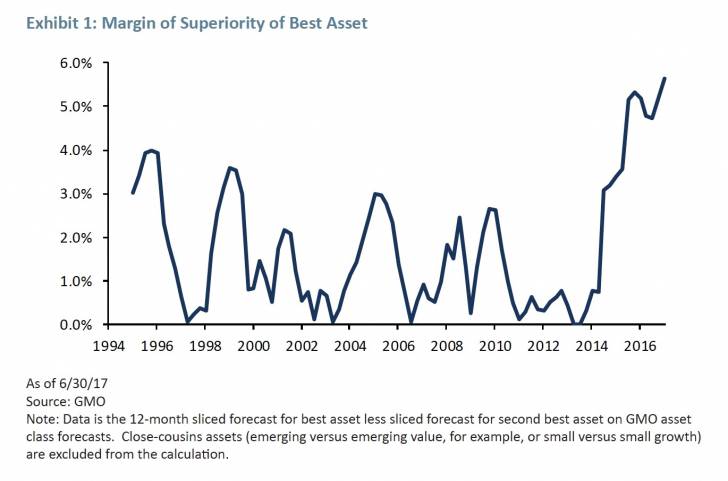
As you can see, much of the time our favorite asset is only a little better than the next best. On those occasions, the cost of diversifying from our favorite asset is fairly low and the benefits of diversification tend to dominate. Of course, we should own plenty of our favorite asset, but not necessarily a lot more than we own of the next best. Today, emerging value is a lot better than anything else, so the drop-off in expected return going from it to the next best asset is severe. How much of it should we hold? That answer, in the end, must come down to risk.
The risk of emerging
There is little question that emerging market value is not only a risky asset, but probably the riskiest of the risky assets we routinely buy in our portfolios. We should expect worse performance from them in the event of a global economic crisis than even other types of equities. Furthermore, emerging economies are subject to home-grown crises, and in periods like 1997-98 or 2014-16 have shown themselves capable of substantial losses even when other risky assets are doing well or at least a lot less badly.
But depending on your definition of risk, 1997-98 was either a big problem or a small one. Let’s first think in terms of running an equity portfolio against an MSCI ACWI benchmark.4
If your view of risk as a portfolio manager is underperforming ACWI, the worst thing that ever happened to emerging was the period from the summer of 1997 to the fall of 1998. In that period, ACWI rose by 4% and MSCI Emerging fell by 48%. It’s a stunningly bad event in relative terms.5
If that didn’t cause equity managers to recognize the risk of betting on emerging, I don’t know what it would take! You could say that it was just as bad in absolute terms, and in a sense that is true. A 48% absolute loss is a big deal in anybody’s book. But given that it was basically an emerging-specific problem, the loss was unlikely to lead to a big drawdown in your overall portfolio. Exhibit 2 shows the returns to various assets during the time period of emerging’s disaster.
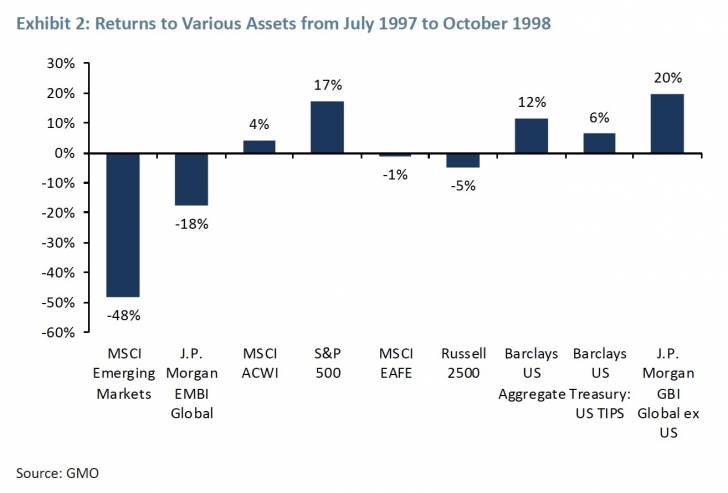
Other than emerging equity and debt, this was a pretty decent time to be an investor. When one thinks about the real risks for a long-term investor, the risks that really matter are events that cause sufficiently acute losses across the portfolio to require a behavior change in spending, or events that cause losses that are not reversed even in the long term. The 1997-98 loss, as bad as it was for emerging, has not meant any permanent loss for emerging market investors.
Since the start of 1997, MSCI emerging has mildly outperformed ACWI, even including that large drawdown. As for emerging debt, the other material loser in the period, since 1997 it has been the best performing of all of the asset classes we track, despite its losses in 1997-98. Emerging equities and debt are volatile assets and move somewhat to an “emerging” rhythm. This means that the potential for them to underperform other assets is quite material, but so is their ability to beat them. In other words, for an investor more concerned with absolute risk and return than relative, they can offer valuable diversification.
But let’s not kid ourselves. Emerging is also a risky asset that can be relied upon to perform poorly in events that really do matter. From the 2007 high for ACWI to the 2009 low, ACWI lost 55%. MSCI Emerging lost 62%. This may not sound like a big difference, but in order to recover the losses, ACWI had to rally 122%, whereas MSCI Emerging needed to rally 160%, a difference of 38 percentage points.
So for an investor focused on absolute return and risk, emerging is a risky asset class – let’s say a factor of 1.2 on platonic “equity depression risk,” although that is only an educated guess. But the fact that it is also capable of large losses at times when other assets do just fine is not necessarily such an issue. Even on the “Hell” version of our forecasts, where returns to all equities are higher, emerging market value stocks have an expected real return about 2.4 times higher than the next best equity group. On the “Purgatory” version, the ratio is 5.4 times.6
A return multiple of over 2.0 and a risk multiple of 1.2 argues for owning emerging equities to the exclusion of all other equities.
Why not go all the way to that, with perhaps 50% of our portfolio in emerging equities and no other risky assets? This portfolio would have similar “depression risk” to a standard 60% stock/40% bond portfolio and a hugely higher return on our forecasts – about 5% better than the traditional portfolio for the next 7 years. One reason not to do this is that this takes the “emerging-specific problem” event and turns it into a really meaningfully nasty event for the portfolio. If there were another -48% return from emerging such as we saw in 1997-98, we wouldn’t be bailed out by the performance of other assets in the way a diversified portfolio would be.
Even if emerging came back as it did after that crisis, a 25% overall portfolio loss is a big loss. And just as important, given the fact that the large loss would come from a single volatile asset class, I’m also willing to bet that it would be a large enough loss to cause pretty much any investor (including GMO) to think twice about rebalancing into the pain, which is generally the right thing to do in such events. So let’s agree that 50% is too large a position. What is the right size? Given the size of the expected return premium for emerging value over everything else, it’s not really driven by the expected return gap but by risk.
The risk of emerging today
What can we think about the risk of emerging today versus points in the past? Certain things are clear. If the causes of previous crises in emerging have generally been currency or credit blow-ups, we are in better shape than we have been in the run-up to previous crises. Exhibit 3 shows the valuation of a basket of EM currencies over time.
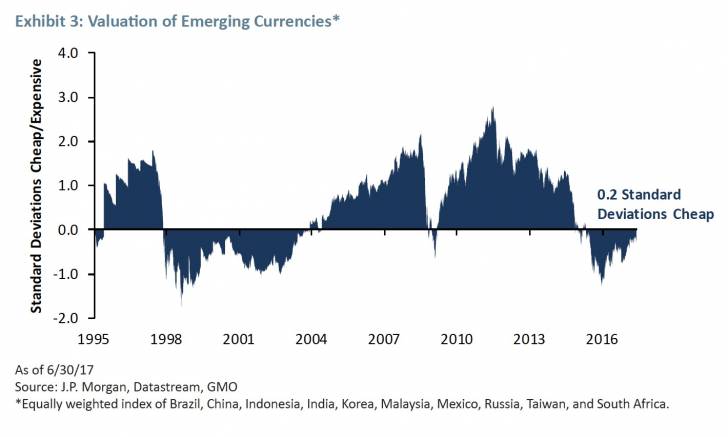
You can see that in the run-up to 1997-98, 2008-09, and 2011-15, emerging currencies were quite overvalued. In all of those cases, currencies got to at least 1.5 standard deviations overvalued. Today, even given a recovery from the 2015 lows, they are mildly cheap on our forecasts. A currency crisis therefore seems an unlikely driver of emerging problems. On the credit side of things we are likewise not in an obvious danger zone, as can be seen in Exhibit 4.
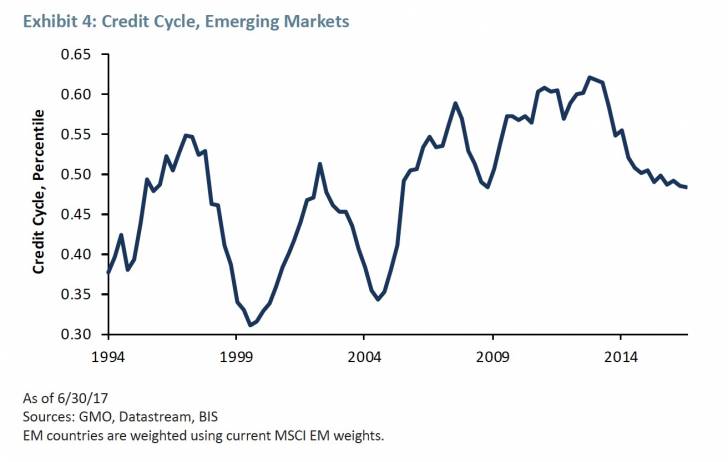
EM countries are weighted using current MSCI EM weights.
The current score on the credit cycle is 0.48, where 0.5 is neutral, and it has been coming down gradually over the last few quarters. Previous emerging crises saw this model top out between 0.55 and 0.65 before the crisis hit. Emerging is not a monolithic group when it comes to credit, and the most notable “hot” country is China, which is well above neutral. Exhibit 5 shows the cycle for China in particular.
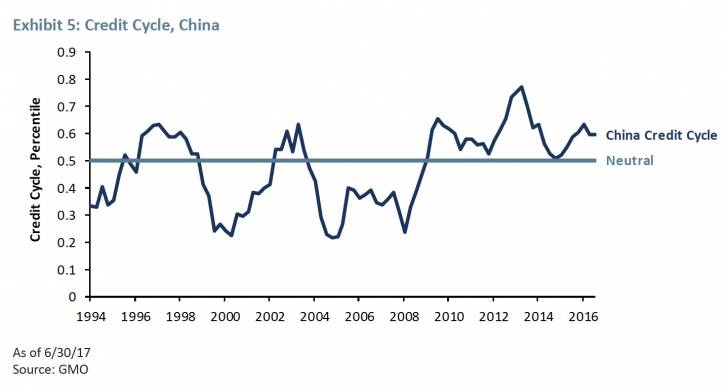
On this model, the credit cycle has come down from the recent peak but is still at an elevated level. This argues to us that the risk of broad contagion in emerging from a credit event in China is not horribly high, but we need to be aware of the risk of credit problems coming from China. An elevated credit cycle is by no means a guarantee of a credit crisis, but it certainly creates the conditions for a crisis to take hold.
Given this data, it does not seem as if a 1997-98 currency crisis repeat is a high likelihood, but a credit-driven problem in the most important emerging economy is a meaningful possibility. And given the absolute valuations in emerging, losses in a bad event for emerging could be quite painful. We believe a worst case scenario is lower probability than normal, but by no means off the table.
Cromwell risk and the 30% solution
Given that the margin of superiority for emerging value is extremely high and the risk seems slightly less than normal, it is clear we should own a lot of emerging, but not necessarily what “a lot” should be. I’d love to tell you we have a scientific method of determining the ideal weight and we are completely confident we are at that weight, but that simply isn’t true.
Given the state of the credit cycle and the absolute valuation of emerging, we want to be at a weight that is less than our true maximum. But how much lower an expected return every other asset has than emerging value, the maximum emerging weight for emerging value should be higher than it is when emerging market equities are only mildly cheaper than other assets. This is where another, harder to quantify risk comes into play. I don’t have a perfect term for it, but let’s call it “Cromwell risk.” Oliver Cromwell, in a letter to the Church of Scotland in 1650 wrote, “I beseech you, in the bowels of Christ, think it possible that you may be mistaken.”7
We are believers in value. We believe that cheap asset classes will outperform expensive ones in the long run. Historically, the evidence is in our favor, but that does not mean that every cheap asset does well. Value can be wrong. On the individual stock side, “value traps” – optically cheap companies whose fundamentals wind up deteriorating so fast that the cheapness turns out to have been an illusion – abound. On the asset class side, the odds are better, but still not 100%. On our data, emerging value is the cheapest asset around today. Despite the fact that we know it can take large losses, our belief is that its volatility will not impact its longer-term performance. But there exists some risk that even though cheap assets normally do well, emerging value is, this time, a value trap.
A compelling reason to diversify our multi-asset portfolios is that we are more confident that a portfolio of several different cheap-looking assets will outperform than that the single cheapest-looking one will. We need to trade off Cromwell risk – which always argues for diversification – against the expected opportunity cost of the diversification. In this case, we increased the maximum weight we’d contemplate having in emerging from 25% to 30% for our Benchmark-Free Allocation Strategy and made similar shifts in other asset allocation strategies with benchmarks. The high cost of diversification argues for a higher maximum emerging weight than we would otherwise be willing to live with. Given the state of the credit cycle and the absolute valuation of emerging, we want to be about 80% of the way through the range today, which gives us room to buy more if we do get an emerging, or global, crisis.
This shift in the maximum weight for emerging led us to buy a few percent more emerging value in July, despite emerging’s strong performance this year. Because an equity portfolio with more emerging has a meaningfully higher expected return, the money for this came from a combination of lower expected return equities (US high quality stocks) and non-equities, increasing our total equity weight at the margin.8
Is this a profound change to the stance of our portfolios? No. We still have materially less “depression risk” than a standard portfolio, given our low weight in equities overall. Emerging value was, by a large margin, the most important risk exposure in our portfolio. Now it is a little more so. Looked at this way, it seems mostly business as usual. But today isn’t a usual time. Normally when we buy more of an asset it is because we are moving farther through the range toward its maximum weight. This time it wasn’t so much the percent of the way through the range that changed, but the range itself.
Footnotes:
1 The apparent 1% gap in returns (10% return less 3% value increase = 6% more expensive) is because of inflation over the period.
2 The only exceptions were low quality stocks, with an expected return of 4.7%, and emerging debt at 5.7% real.
3 In calculating margin of superiority, we are excluding close-cousin assets that do not provide much diversification in the portfolio. For example, currently the second best asset forecast after emerging value is the overall emerging equity asset class, which is “only” 2.9% worse than emerging value on this basis. But diversifying from emerging value by buying broad emerging as well doesn’t make sense. The major risk (EM risk) is the same, so the risk benefit of diversification is far smaller than the cost of giving up the extra return of the value stocks.
4 ACWI is short for MSCI All Country World index and is a market capitalization weighted index of stocks around the world.
5 Specifically, this is the return from the end of July 1997 to the end of October 1998.
6 As a reminder, the “Purgatory” version of our asset class forecasts assumes that equity valuations revert to around 16 times normalized earnings over 7 years. The “Hell” version assumes we will revert to a normal P/E of around 20 times earnings. Given that higher equilibrium level, expected returns over the next 7 years would be higher for all equity groups in “Hell” than in “Purgatory.” The flip side, however, is that the very long-term returns to all assets are lower in “Hell” given the higher average valuations.
7 Oliver Cromwell is an interesting figure to be associated with a statement that can be so easily read as referring to essential limits of knowledge, as he does not seem to have suffered from much personal doubt in his correctness, either as a political and military leader or from a religious perspective. But let’s not let a little potential hypocrisy stand in the way of one of the great quotes of history.
8 This is, of course, only true for our multi-asset portfolios. Equity-only asset allocation portfolios funded all emerging buys out of other equities.
Copyright © GMO LLC